


As a trader, having the right indicators on your chart can make all the difference in your success. In this post, we’ll explore three key indicators that are essential to have on your chart at all times.
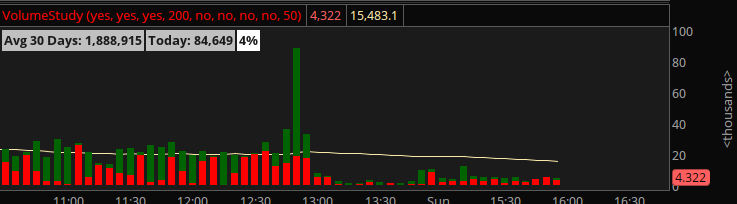
Volume
Volume is one of the most important indicators that traders use to make decisions. It tells you when there are active big buyers or sellers in the market, which can help you determine the market’s direction. If you see low volume on a day before an economic event, it may be a good sign to not participate in the market because other big players are not participating. Similarly, if you see a breakout on low volume, it typically indicates a false breakout, and you may see a reversal coming into the market.
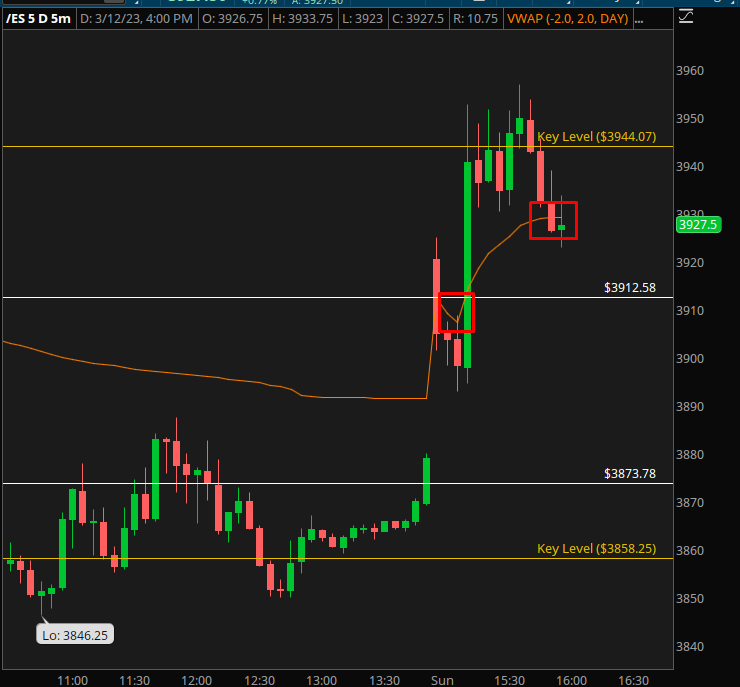
VWAP (Volume Weighted Average Price)
VWAP is another crucial indicator that traders use to determine the average price for a stock for a given day or session. If the stock you’re trading is below the VWAP for the entire day and then pulls back into it, it may be a great entry point for a short. Large banks or institutions often trade around the VWAP, making it an important level to watch for entry and exit points.
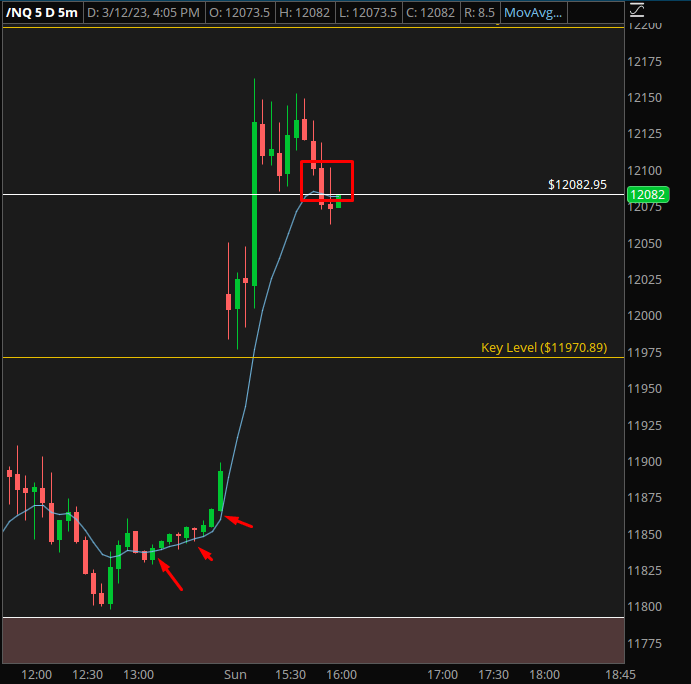
9EMA (9-Day Exponential Moving Average)
The 9EMA is an indicator that shows the short-term sentiment of the market. It’s particularly useful for catching trend days, when the market is going straight down or up in one direction. Using the 9EMA can help you ride massive trends and benefit from trending environments when the market is going up or down in a decisive fashion.
In conclusion, these three indicators are essential for any trader’s chart. By using volume, VWAP, and the 9EMA, you can gain a deeper understanding of the market and make more informed trading decisions.
We have more in-depth articles linked on each header if you want to go in depth with each indicator. If this article helped you, please share it with friends and consider joining our newsletter for more weekly analysis!