


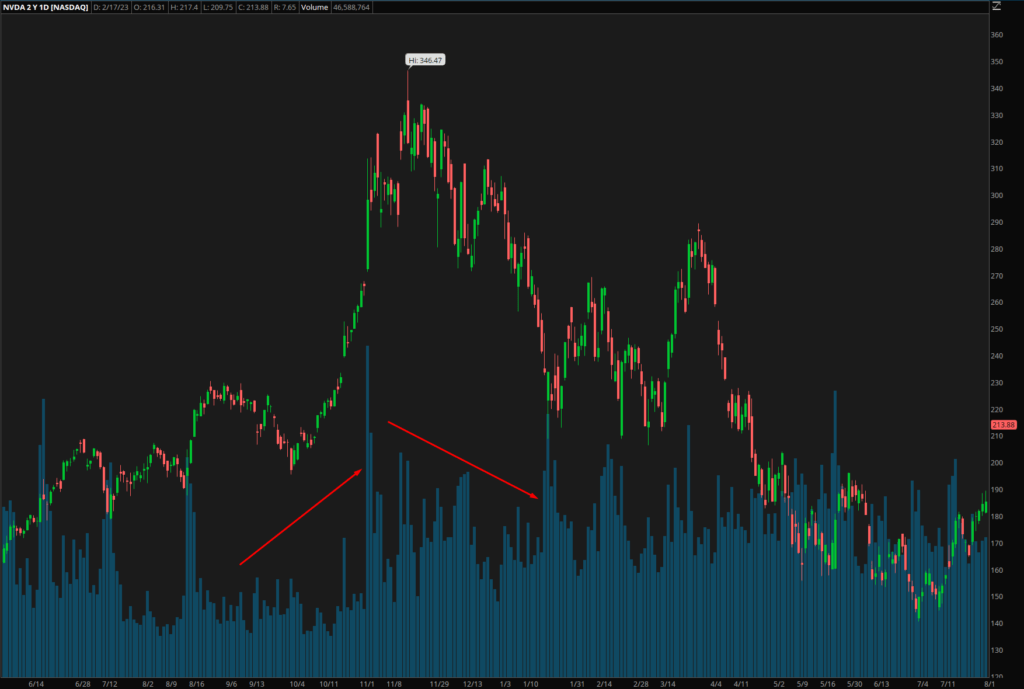
Understanding Volume in Day Trading
Volume is an often overlooked but incredibly important aspect of day trading. Understanding volume and how to use it can help traders make informed decisions and increase their chances of success in the market. In this blog post, we’ll explore the basics of volume in day trading and how traders can use it to their advantage.
Using Volume to Identify Trends
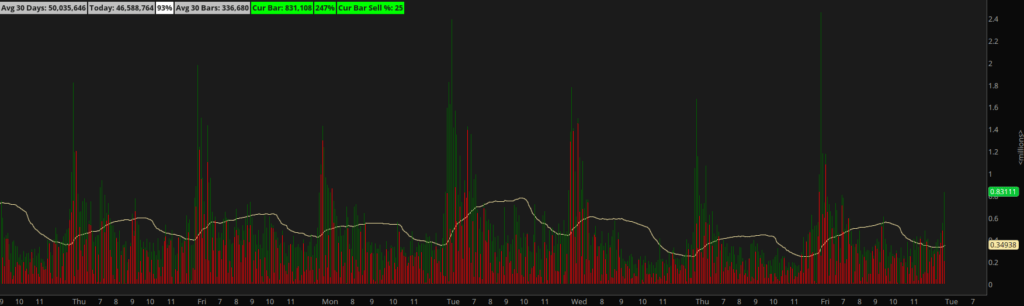
Volume is simply a measure of the number of shares or contracts that are traded in a given time period. This can be measured in a variety of ways, but the most common measurement is the number of shares traded in a single day. When day traders analyze volume, they are looking at how many shares of a particular stock have been traded over a certain period of time.
Confirming Price Movements with Volume
There are a few key ways that traders can use volume to their advantage in day trading. Firstly, volume can help traders identify trends in the market. When the volume of a stock is high, it is often an indicator of increased interest in that stock and can signal a potential trend. Conversely, low volume can indicate a lack of interest or a potential reversal in the trend.
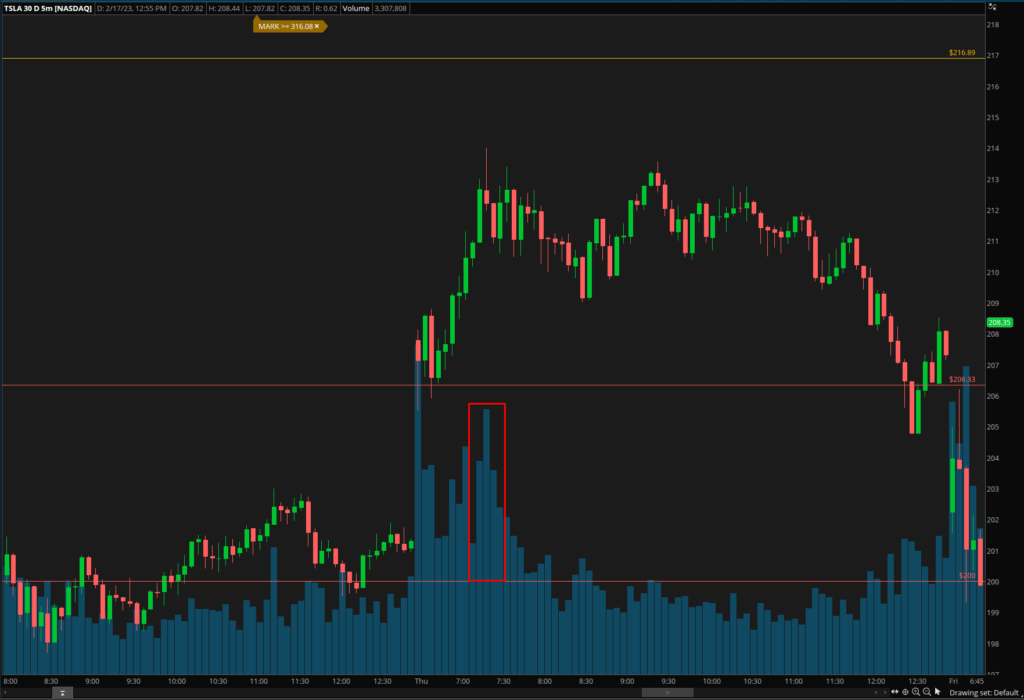
Another way that traders can use volume is to confirm price movements. When a stock is experiencing a sharp price movement, an increase in volume can indicate that the move is genuine and likely to continue. Conversely, a sharp price movement without an increase in volume may be a false signal and not likely to continue.
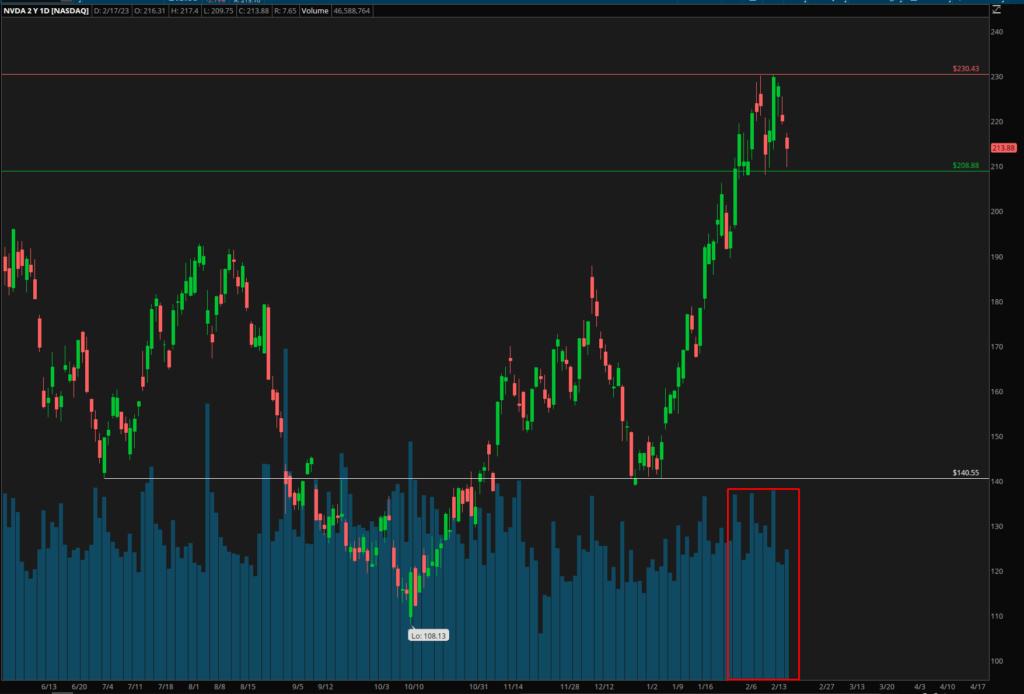
Determining Support and Resistance Levels with Volume
Volume can also be used to determine the strength of support and resistance levels. When a stock is approaching a support or resistance level, an increase in volume can indicate a strong level of support or resistance. Conversely, low volume at these levels can indicate that the level is weak and may not hold.
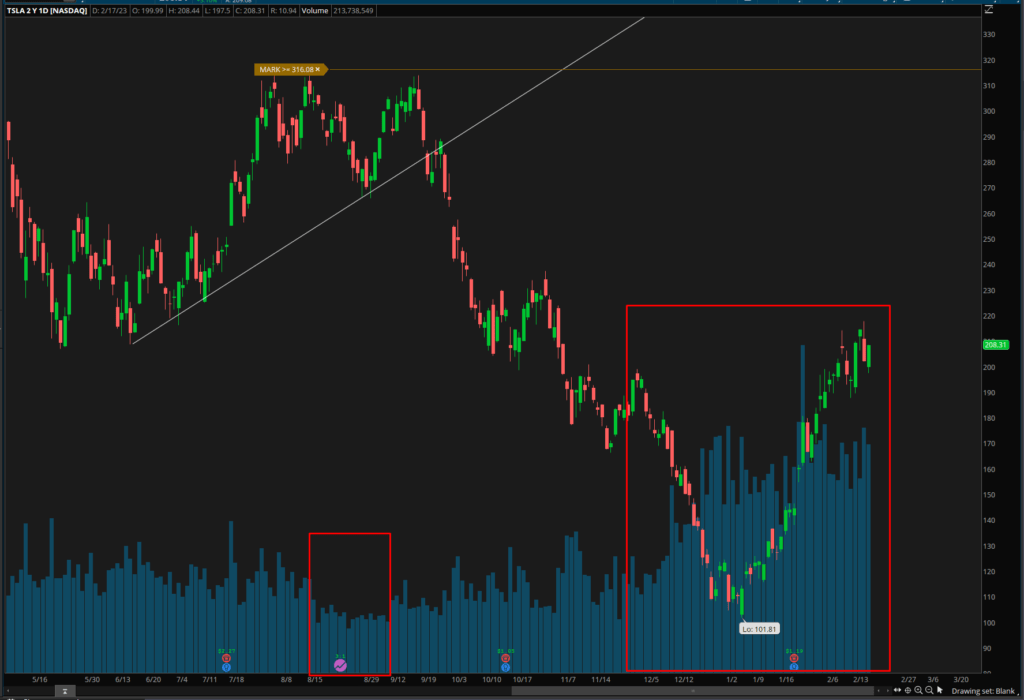
Assessing the Health of a Trend with Volume
Traders can also use volume to determine the health of a trend. In a healthy trend, volume should increase as the trend progresses. Conversely, a decrease in volume can indicate that the trend is losing momentum and may be coming to an end.
Incorporating Volume into Your Day Trading Strategy
In conclusion, volume is an important aspect of day trading that should not be overlooked. Understanding how to use volume can help traders make informed decisions, identify trends, confirm price movements, determine the strength of support and resistance levels, and determine the health of a trend. Incorporating volume analysis into your day trading strategy can help you increase your chances of success in the market.
Don’t miss out on the latest day trading insights and strategies! Sign up for our newsletter now and stay ahead of the game. Option Drops | Newsletter