


Introduction to Supply and Demand Trading
Supply and demand trading is a key concept for any day trader looking to make informed decisions in the stock market. In this blog post, we’ll delve into the fundamentals of supply and demand trading and show you how to use this knowledge to your advantage.
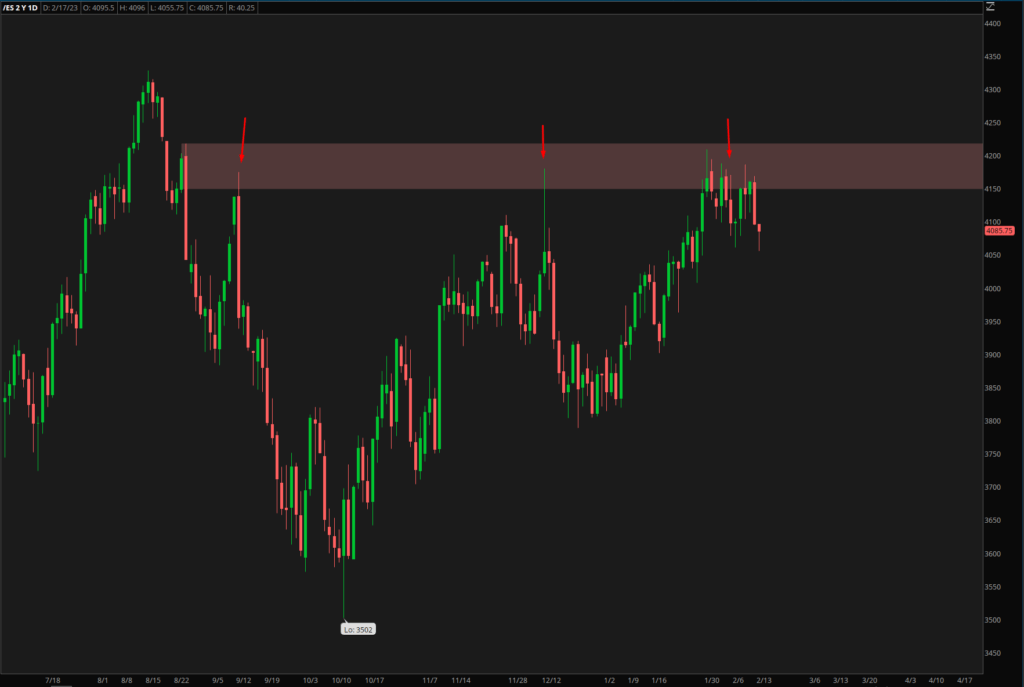
Identifying supply and demand zones in the market can be made easier by searching for large “impulse” moves. Significant events such as FOMC, speeches by Jerome Powell, and the release of economic indicators like CPI can trigger significant swings in the market. By pinpointing areas where a high concentration of buyers or sellers are present, traders can simplify their trading and create favorable risk-reward opportunities.
Understanding the Fundamentals of Supply and Demand
As the backbone of economics, supply and demand plays a crucial role in determining the price of stocks. When demand for a stock is high and there is limited supply, the price will rise. Conversely, when there is an excess of supply and low demand, the price will fall. By understanding these forces, traders can make smarter decisions about when to buy and sell stocks.
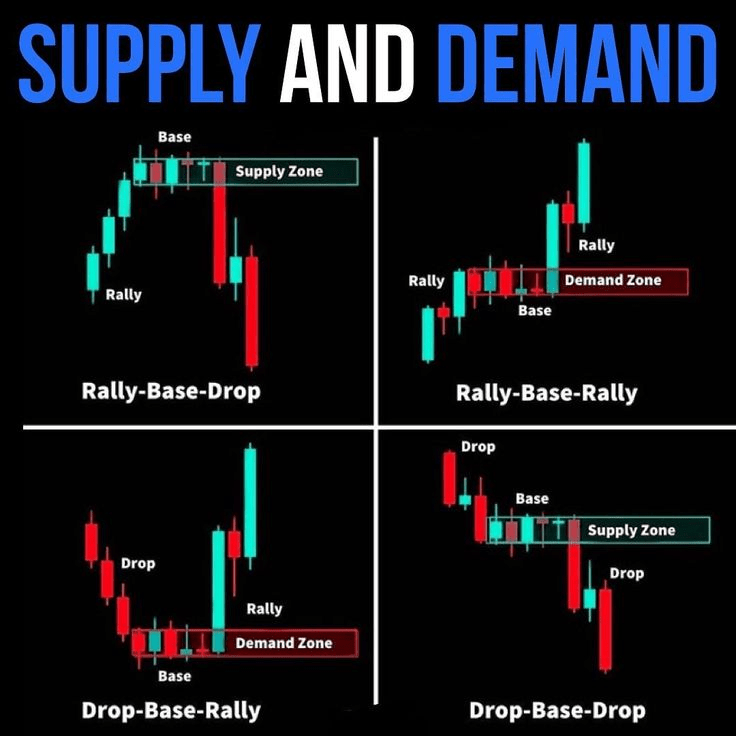
Four Patterns of Supply & Demand
When identify supply and demand zones, there are four patterns to be looking for.
- Rally Base Rally (RBR)
- Rally Base Drop (RBD)
- Drop Base Rally (DBR)
- Drop Base Drop (DBD)
Identifying Support and Resistance Levels with Supply and Demand
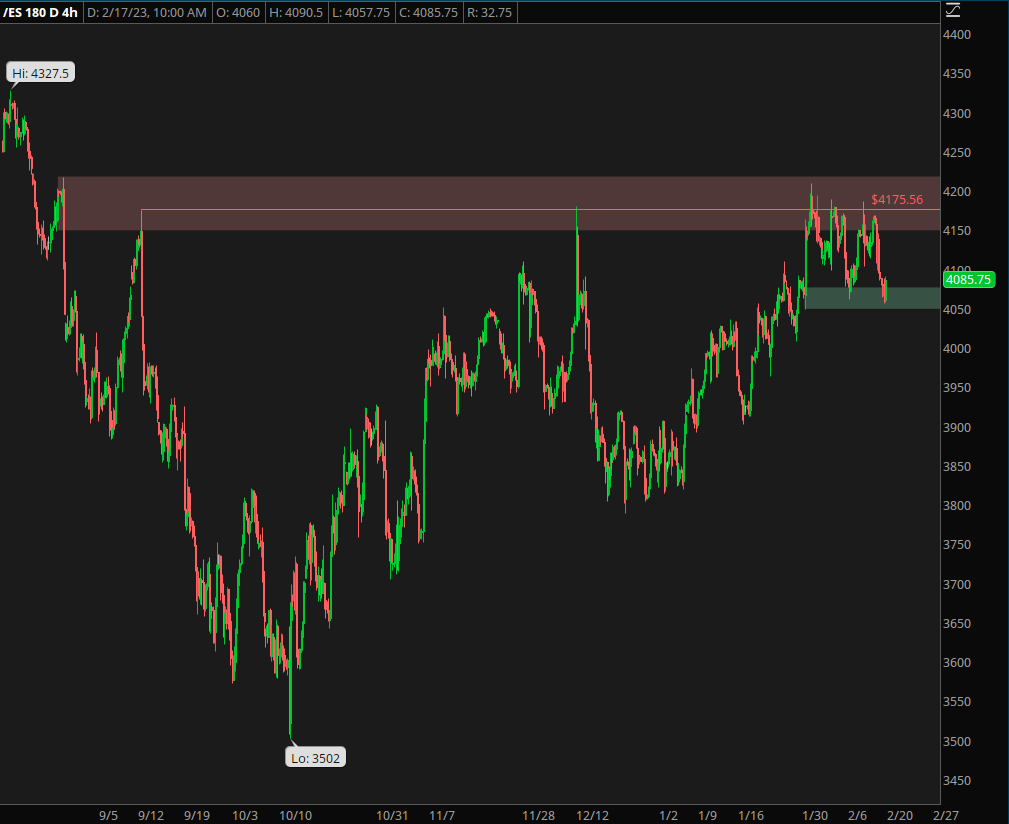
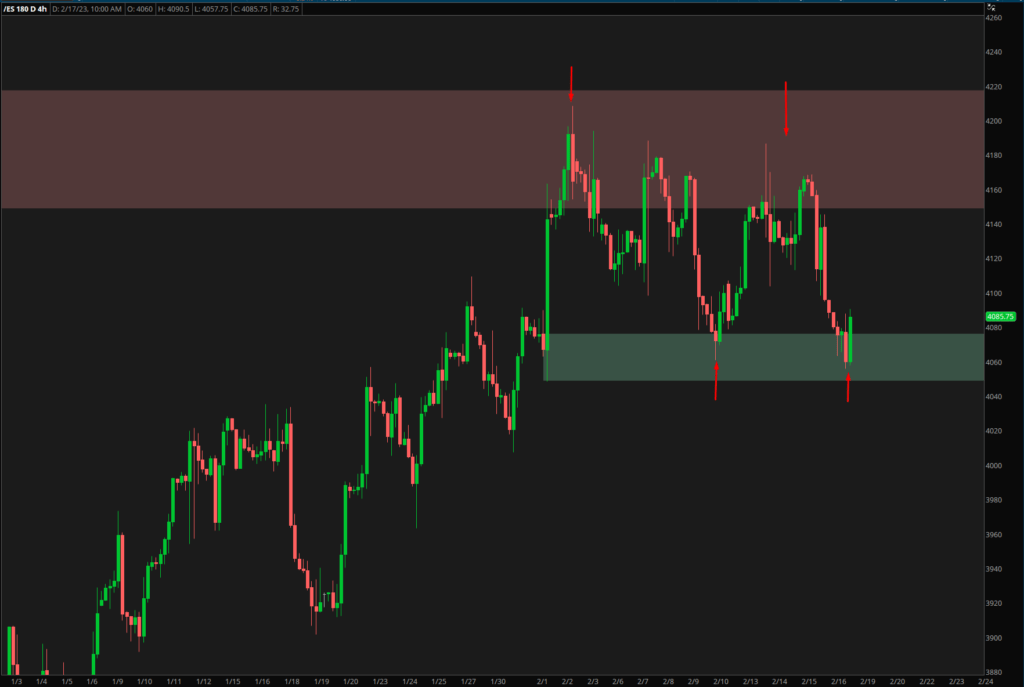
One of the most important applications of supply and demand trading is identifying potential levels of support and resistance. Support levels are where demand for a stock is strong and prices are likely to bounce. Resistance levels are where supply is abundant and prices are likely to fall. By recognizing these levels, traders can make more informed decisions about entering and exiting positions.
Spotting Reversal Patterns with Supply and Demand
Another way to use supply and demand trading is to spot potential reversal patterns. If demand begins to exceed supply, it may indicate a change in the trend. Conversely, if supply begins to surpass demand, it could mean that the trend is shifting. By using supply and demand analysis to identify these patterns, traders can make better decisions about when to enter and exit positions.
Assessing the Strength of a Trend with Supply and Demand
In addition, traders can use supply and demand analysis to gauge the strength of a trend. In a strong trend, prices will rise as demand outstrips supply. Conversely, in a weak trend, prices will fall as supply outpaces demand. By evaluating the overall strength of a trend with supply and demand analysis, traders can make smarter decisions about entering and exiting positions.
The Importance of Supply and Demand Trading in Day Trading
In conclusion, supply and demand trading is a critical tool for any trader seeking to succeed in the stock market. By understanding how to use supply and demand analysis to identify potential levels of support and resistance, spot reversal patterns, and gauge the strength of a trend, traders can make more informed decisions and increase their chances of success.
If you want to receive more market insights and knowledge, consider signing up for newsletter!