


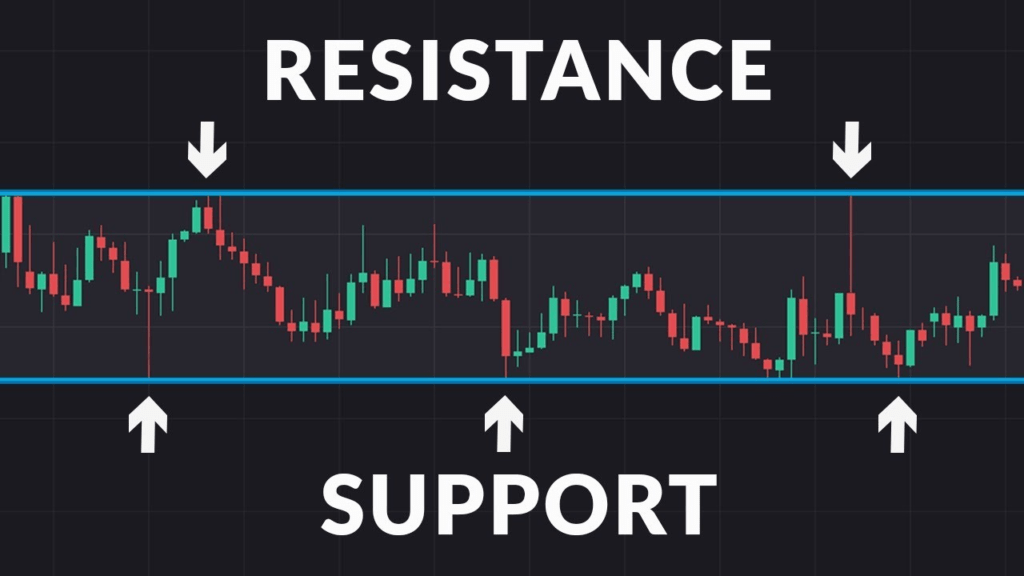
Support & Resistance
Support is where buyers have been established and continue to bounce prices. It serves as a price floor, preventing a further decrease.
Resistance is where sellers are established and continue to reject prices, effectively setting a price ceiling.
These levels act as psychological barriers in price movement and are essential for traders to understand and anticipate market behavior.
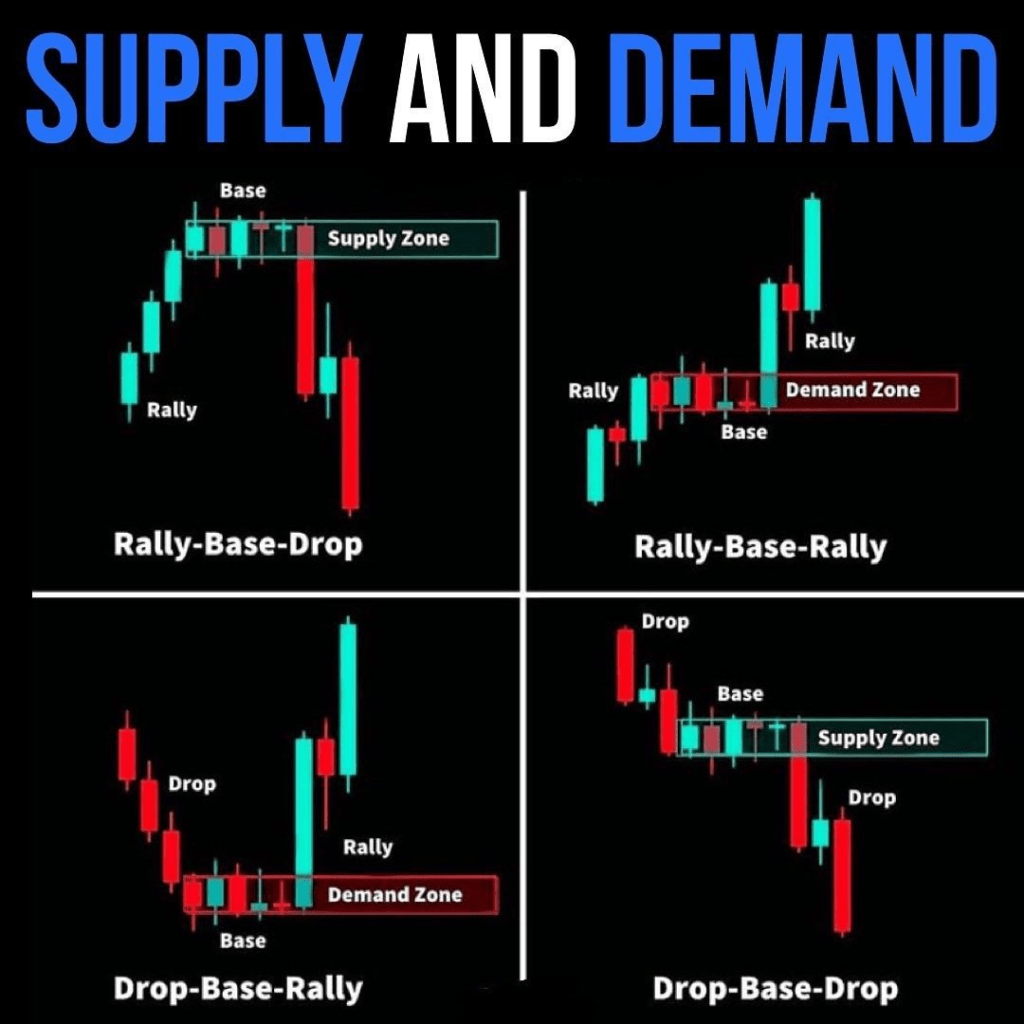
Supply & Demand
Supply and demand focus on market imbalances between buyers and sellers. A rapid price movement often leaves behind unfilled orders from institutions, and when prices revisit these zones, significant price action is likely to occur. Supply and demand zones can be found on every time frame, with higher time frames generally showing more powerful zones.
The key takeaway: zones formed on the 2-hour or daily time frames are much more reliable than those formed on shorter time frames like 5-minute charts.
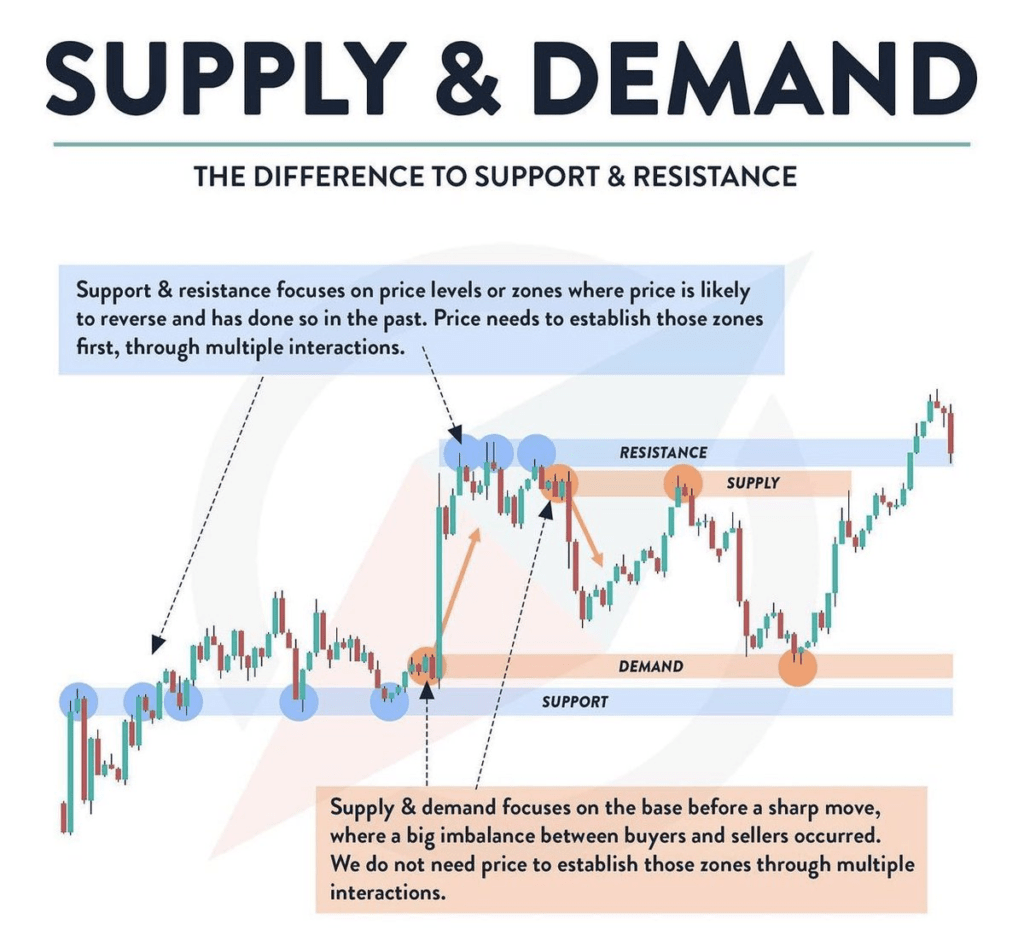
The Difference Between Supply & Demand and Support & Resistance
While Supply & Demand is formed from an impulse move, Support & Resistance requires multiple touchpoints to form. While similar, these concepts are not identical, but they can complement each other.
Supply and Demand zones are more predictive and spontaneous, whereas Support and Resistance tend to develop over time with more confirmation. Using them together helps you make well-informed trading decisions, optimizing for low-risk, high-reward setups.
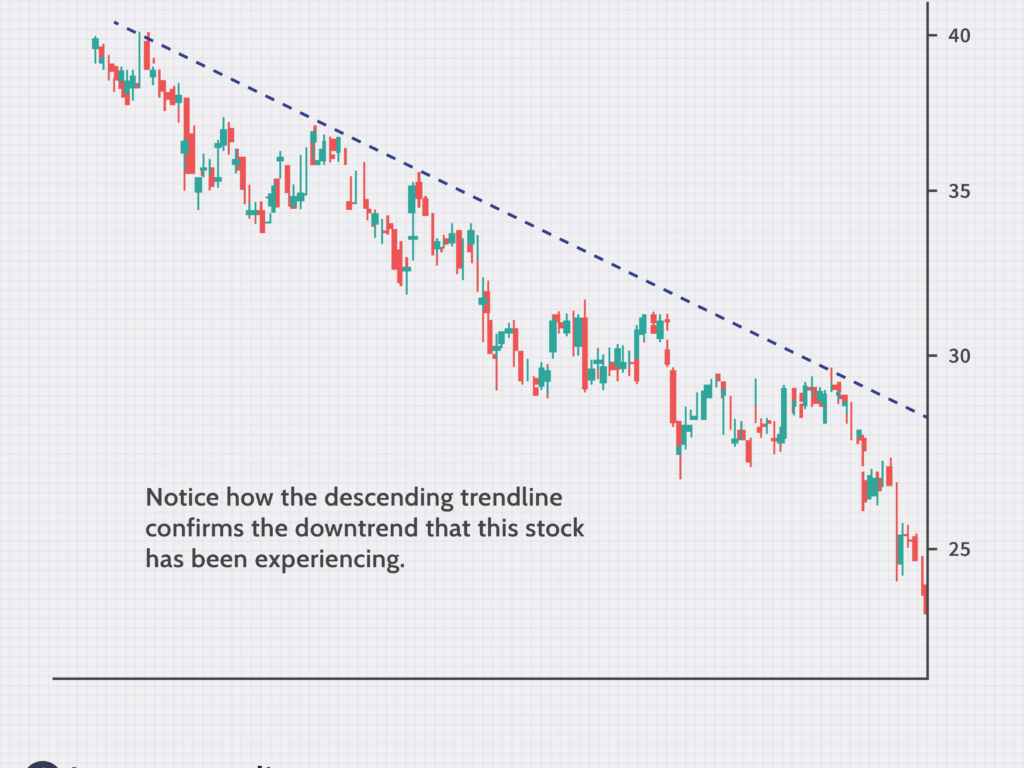
Trendlines
Trendlines are fundamental tools used to identify the direction of price movement. They help identify upward (bullish) or downward (bearish) trends by connecting higher highs and higher lows or lower highs and lower lows, respectively.
By drawing these trendlines, traders can better identify potential reversal points, market entries, and exit strategies.
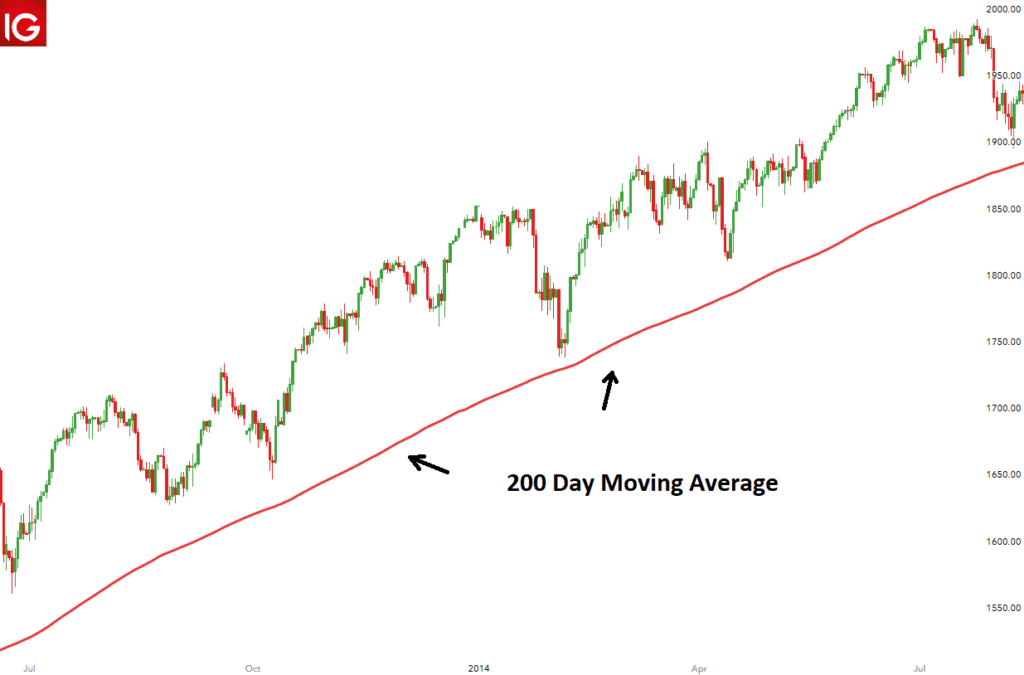
Moving Averages
Moving averages are a powerful indicator used to smooth out price data and identify trends. These averages act as dynamic levels of support and resistance.
Commonly used lengths for moving averages include the 10, 20, 50, 100, and 200-period moving averages.
Traders often utilize moving averages to determine long-term trend direction and assess potential buying or selling opportunities, especially on larger time frames like daily, weekly, or monthly charts.
Oscillators
Many traders rely on oscillators like RSI, MACD, and TEMA to gauge market momentum and potential areas of overbought or oversold conditions. These indicators can be valuable in identifying potential reversal points and confirming trends in conjunction with other technical tools.
Oscillators are particularly useful for short-term traders looking to make precision entries and exits in the market.
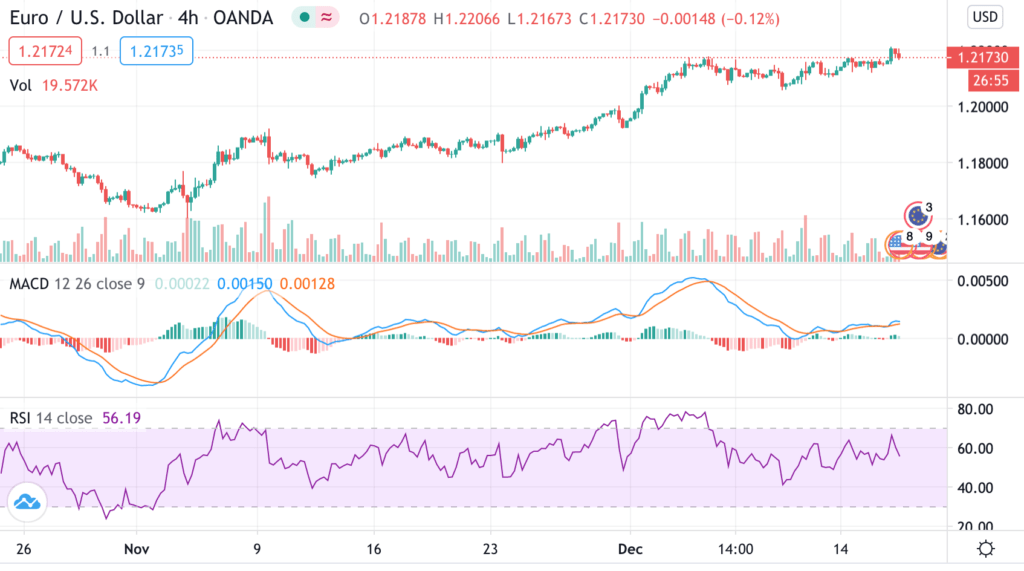
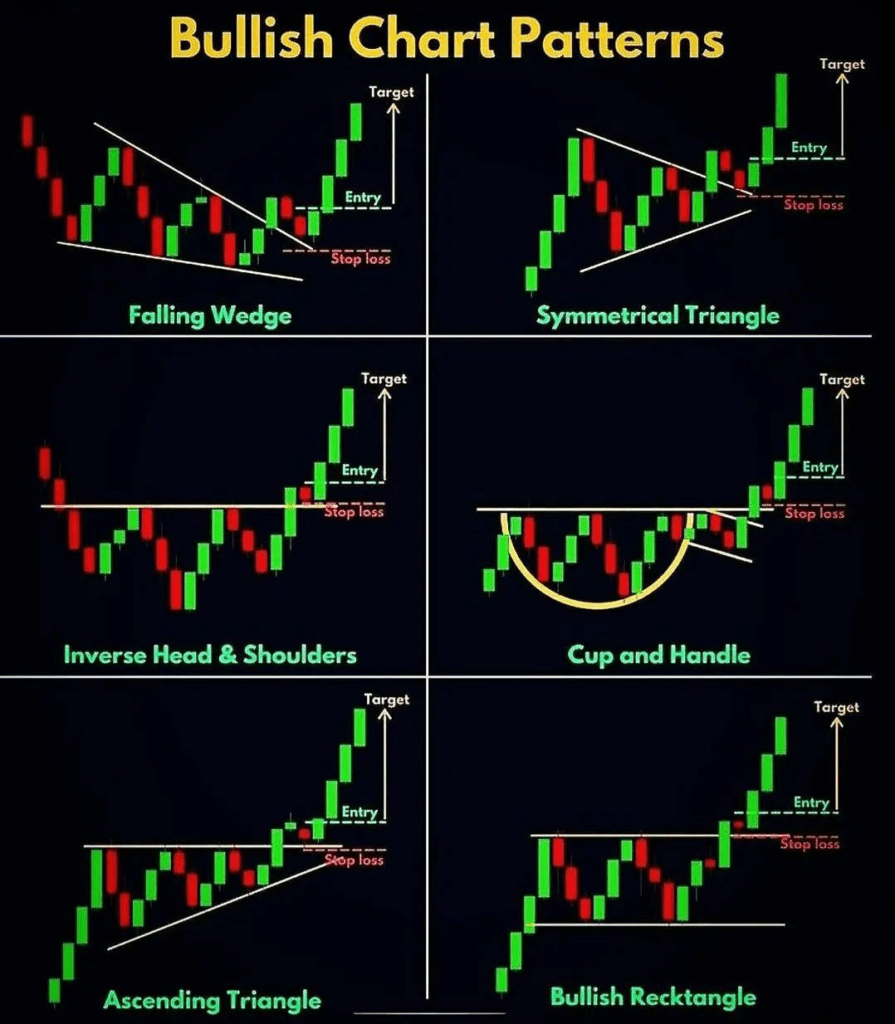
Chart Patterns
Chart patterns provide key insights into the behavior of price movements, signaling potential breakouts or trend reversals.
Bullish Chart Patterns
Bullish patterns often signal a potential upward breakout and can include patterns like:
- Bull Flags
- Ascending Triangles
- Cup and Handle
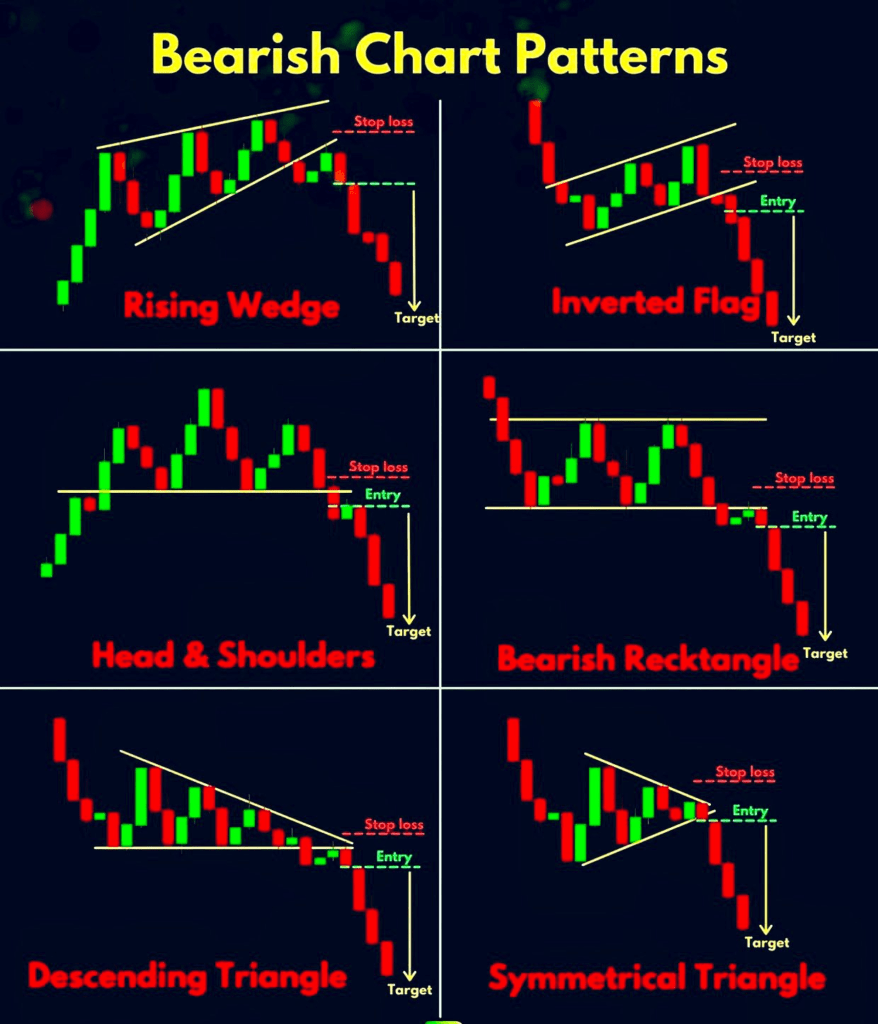
Bearish Chart Patterns
Bearish patterns suggest a possible downward breakout and often include:
- Bear Flags
- Descending Triangles
- Double Top
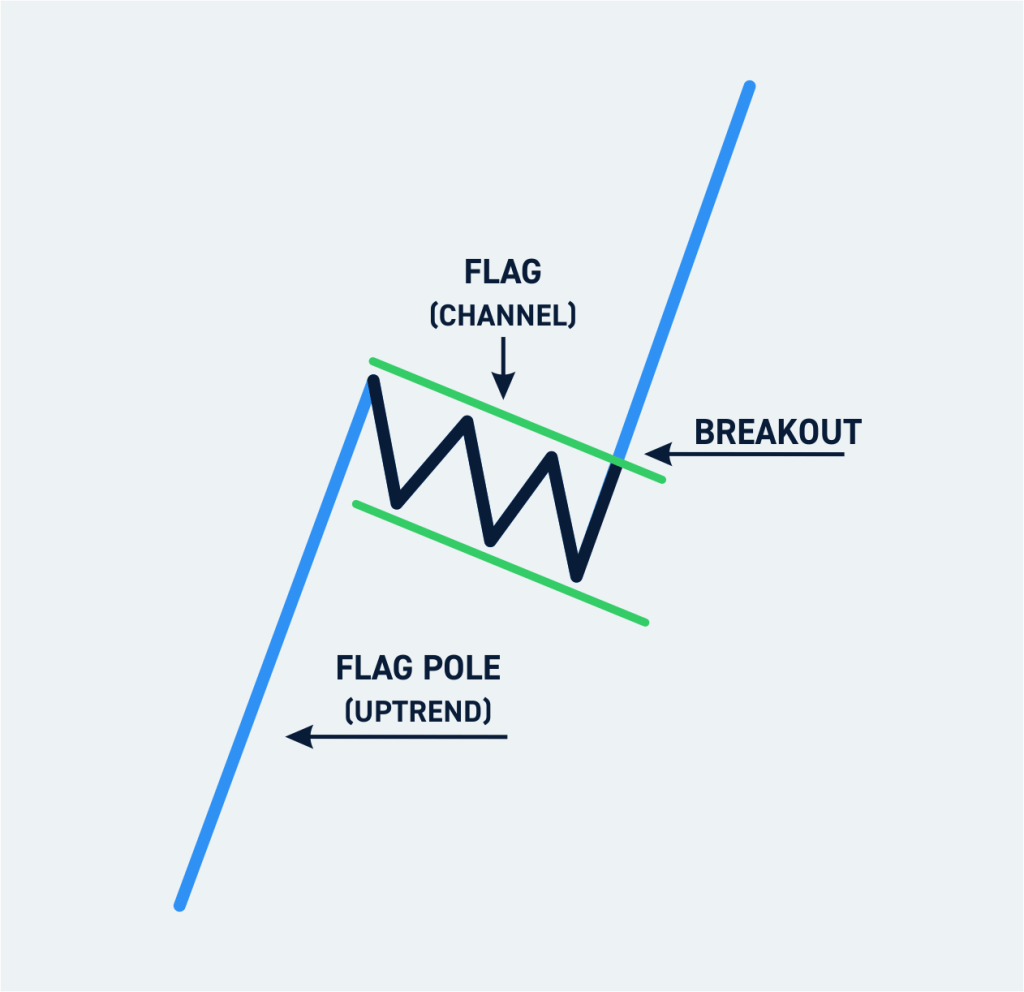
Bull Flag
A Bull Flag forms when the price rises rapidly, followed by a consolidation that slopes downward. The key aspect to remember is that the flag is just a pattern—it does not guarantee a breakout in the same direction. Traders should always be prepared for potential breakouts in both directions.
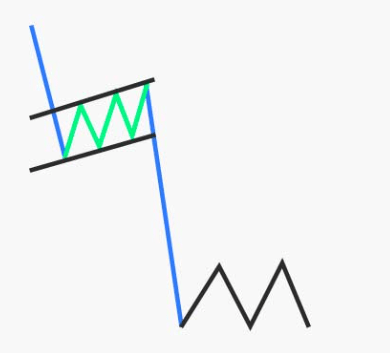
Bear Flag
A Bear Flag follows a similar principle to a bull flag but is formed in a downtrend. The price drops rapidly and then consolidates in a slight upward slope before continuing downward. Like the bull flag, it doesn’t always guarantee continuation in the same direction, so traders must stay alert.
Candlestick Patterns
Candlestick patterns provide visual cues to price movements. Some of the most recognized patterns include:
- Bullish and Bearish Engulfing
- Hammer and Inverted Hammer
- Doji
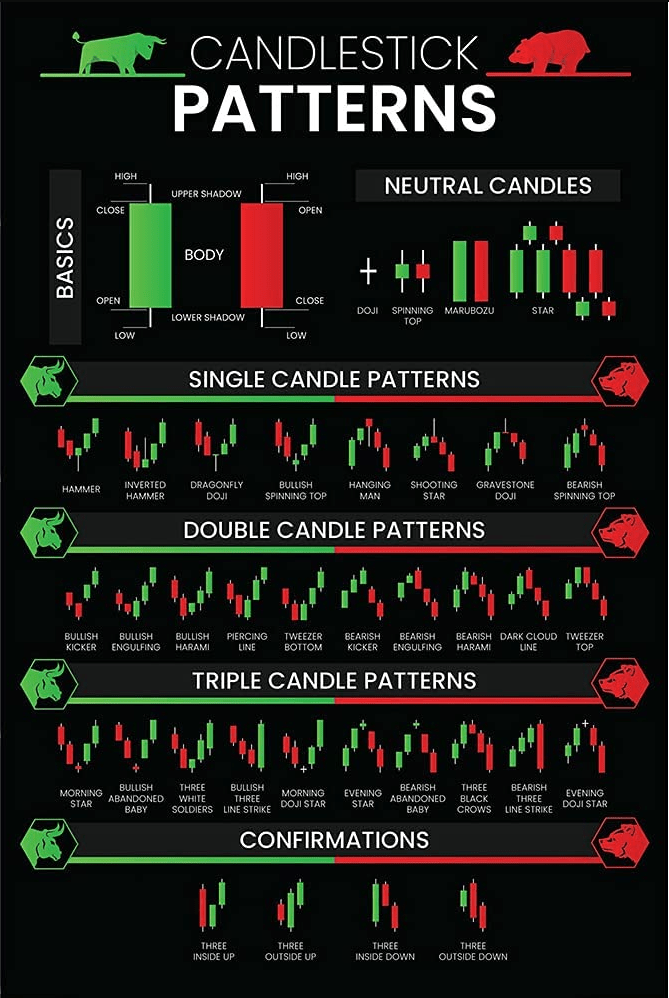
These patterns offer quick insights into price momentum and potential reversals, making them a critical tool for traders.
By understanding these key concepts, traders can better navigate the markets and make informed decisions. Whether you’re trading based on technical indicators like moving averages and oscillators or relying on chart patterns and trendlines, a clear understanding of these tools will give you an edge in the markets.