


Understanding the 200-Day Simple Moving Average
The 200-day simple moving average (SMA) is a commonly used tool in the technical analysis world. It calculates the average price of a specific asset, like a stock or index, over the past 200 trading days. By observing this indicator, traders and investors can get a clearer picture of the market’s overall direction and identify potential trends or reversals.
Why Is the 200-Day Simple Moving Average So Significant?
Long-Term Trend Indicator
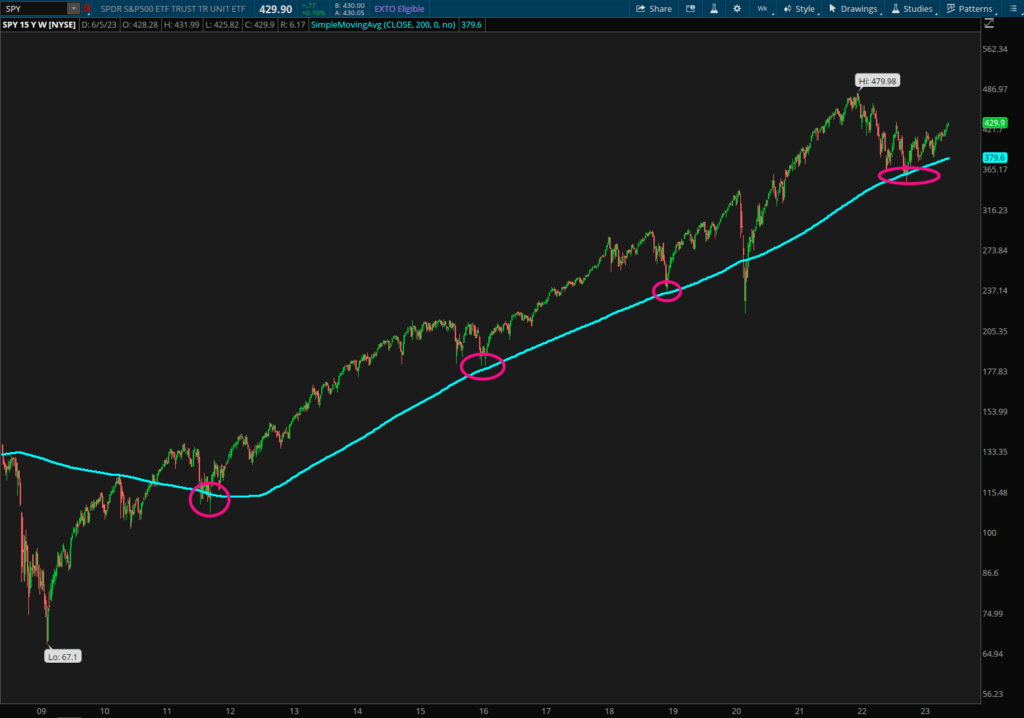
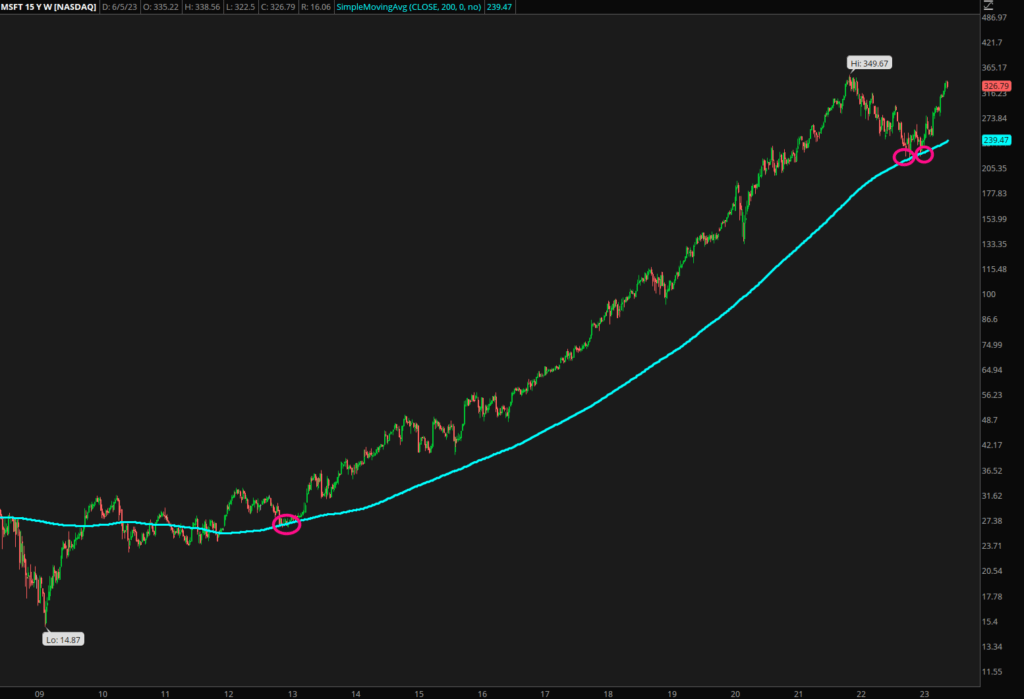
The 200-day SMA provides a valuable perspective on an asset’s long-term trend. When an asset’s price is above its 200-day SMA, it’s generally considered to be in an uptrend, and when it’s below, it’s considered to be in a downtrend. This knowledge can help traders make more informed decisions.
Support and Resistance Levels
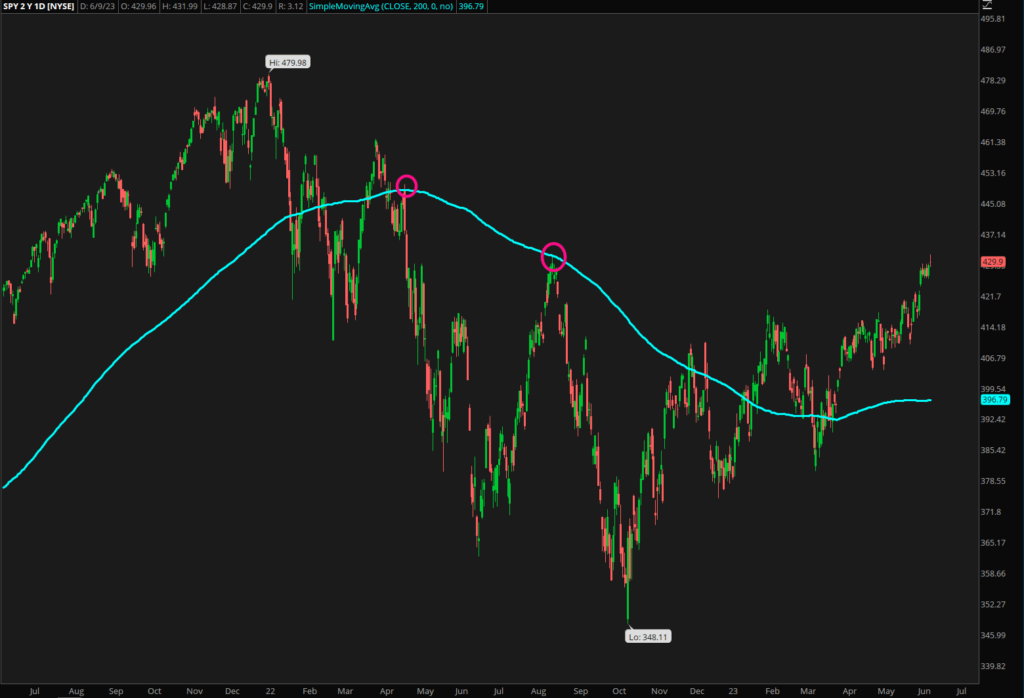
The 200-day SMA can act as a dynamic support or resistance level. If an asset’s price falls towards the 200-day SMA in an uptrend, it often bounces off it – signifying strong support. In a downtrend, the 200-day SMA can act as a resistance level where prices struggle to rise above it.
Backtested Results: Real-world Evidence of Its Importance
Historically, the 200-day SMA has been a reliable indicator of market trends. Several studies and backtesting experiments have proven this.
For instance, according to a study by ETF Replay, a portfolio that moved to cash when an ETF fell below its 200-day SMA would have outperformed a buy-and-hold strategy over the past decade. You can find the detailed results here.
Additionally, a comprehensive analysis by the American Association of Individual Investors (AAII) concluded that using the 200-day SMA method could have significantly improved returns on a portfolio of S&P 500 stocks over several decades. Read more about the study here.
Please note that back tested results are not always indicative of future performance.
How Traders Can Take Advantage of the 200-Day SMA
Trading with the Trend
One common strategy is to trade in the direction of the trend indicated by the 200-day SMA. If the asset’s price is above the 200-day SMA, traders may consider buying the asset. If the price is below the SMA, they may consider selling or shorting the asset.
SMA Crossovers
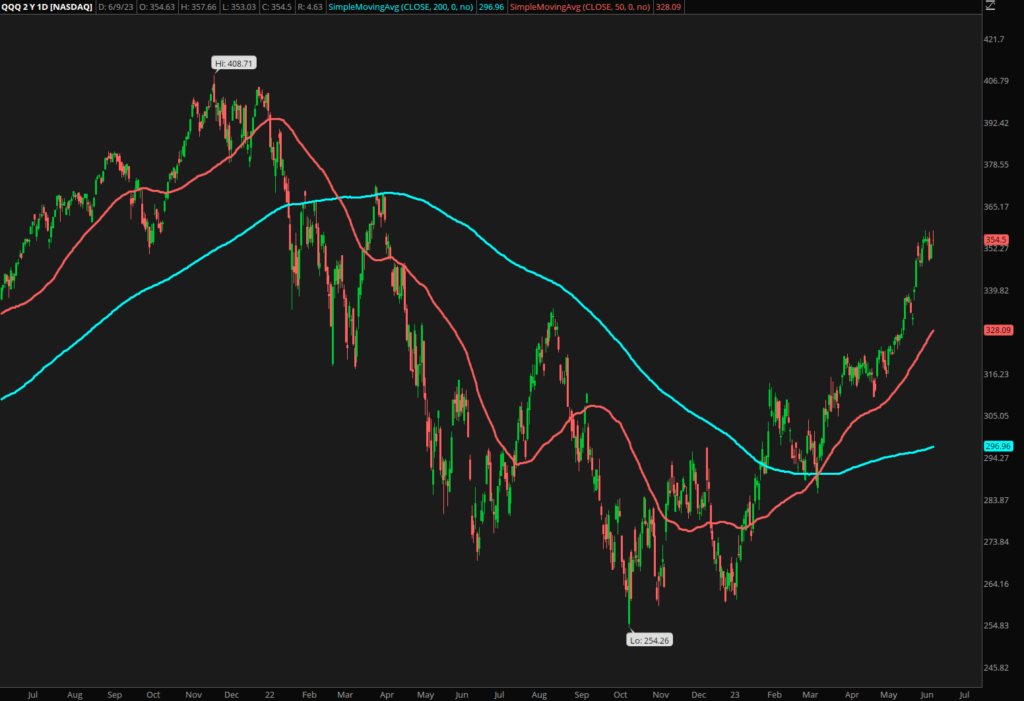
Another strategy is to look for crossovers between shorter-term moving averages (like the 50-day SMA) and the 200-day SMA. When a short-term SMA crosses above the 200-day SMA, it could signal the start of an uptrend, offering a buying opportunity. Conversely, when a short-term SMA crosses below the 200-day SMA, it could signal a new downtrend, presenting a selling opportunity.
Conclusion
The 200-day SMA is a powerful tool that can help traders understand the broader market trend, identify potential support and resistance levels, and make more informed trading decisions. It’s not infallible, but it is backed by considerable historical evidence and is widely respected in the trading community. As with any trading strategy, it should be used in conjunction with other tools and techniques to maximize its effectiveness. Happy trading!
If you found this article helpful, be sure to check out our weekly newsletter breaking down stocks and futures for free!