Introduction
If you’re looking to make a splash in the world of trading and investing, understanding trendlines is essential. In this comprehensive guide, we’ll break down the concept of trendlines and how to use them to make informed trading decisions. By mastering the power of trendlines, you can improve your ability to spot profitable opportunities in the market.
What are Trendlines?
Trendlines are a vital tool in technical analysis, used to identify and visualize the direction of a market’s price movements. By connecting the significant highs or lows of a price chart, traders can track the underlying trend of a security, whether it’s bullish (upward) or bearish (downward).
Why Use Trendlines?
Trendlines offer several key benefits for traders and investors:
- Identify Market Trends: By drawing trendlines, you can quickly visualize the market’s direction and gauge its strength, helping you make informed decisions on potential entry and exit points.
- Support and Resistance Levels: Trendlines act as dynamic support and resistance levels, offering critical information about potential price reversals or breakouts.
- Risk Management: Incorporating trendlines into your trading strategy can help minimize risk by identifying stop-loss levels and managing your positions effectively.
How to Draw Trendlines
To draw accurate trendlines, follow these simple steps:
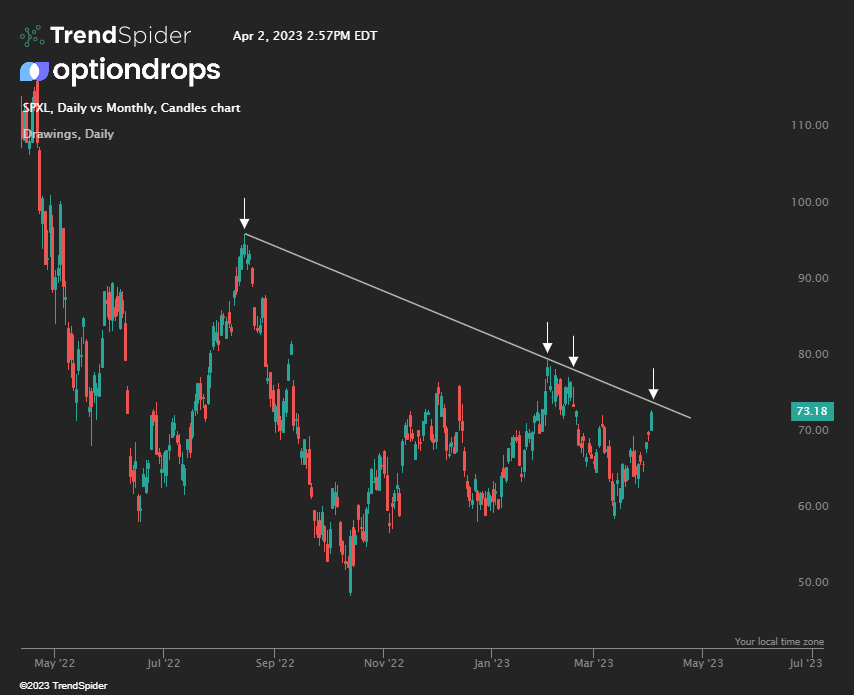
- Identify the Trend: Start by determining whether the market is in an uptrend or downtrend. In an uptrend, prices make higher highs and higher lows, while in a downtrend, prices make lower highs and lower lows.
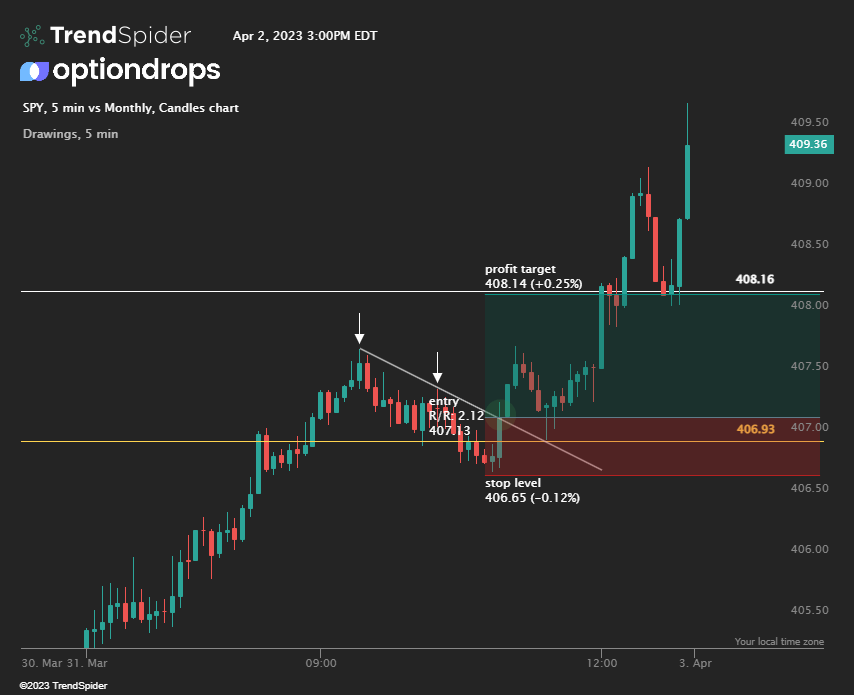
- Connect the Dots: In an uptrend, connect the higher lows with a straight line. In a downtrend, connect the lower highs with a straight line. Ensure that the line touches at least two significant price points.
- Validate the Trendline: A valid trendline should have at least three touches. The more touches, the stronger and more reliable the trendline.
Trendline Zones
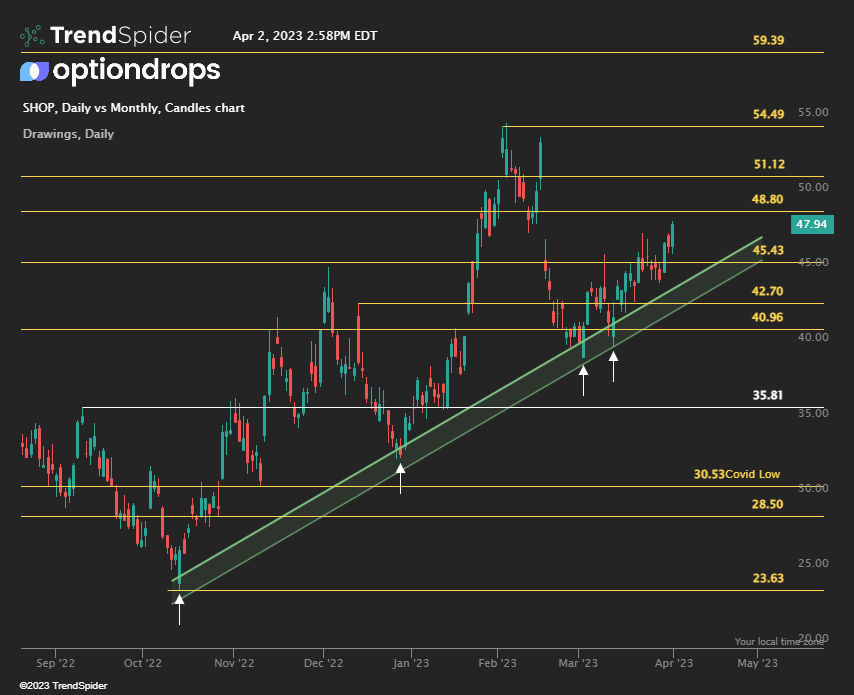
One effective method to circumvent false breakouts while trading with trendlines is to implement a zone or range strategy. Drawing zones, akin to supply and demand areas, allows for greater flexibility in your trades, accommodating minor fluctuations in price movement. This approach recognizes that prices may momentarily overshoot the trendline, yet still experience rejection or increased buying activity. By considering a designated price zone rather than a strict trendline, traders can account for slight deviations and avoid prematurely exiting positions. Ultimately, incorporating zones into your trendline strategy can lead to more accurate trade execution and improved risk management, enhancing overall trading performance.
Trading with Trendlines
Once you’ve drawn your trendlines, use them to make informed trading decisions:
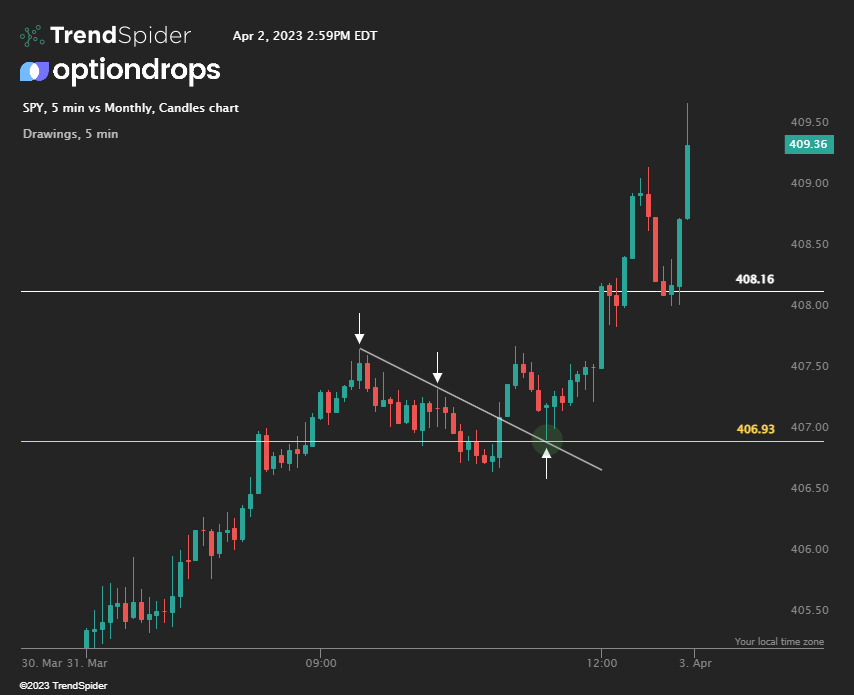
- Entry Points: When prices approach the trendline in an uptrend, consider buying as the price bounces off the support level. Conversely, in a downtrend, look for selling opportunities when prices bounce off the resistance level.
- Exit Points: If the price breaks through the trendline, it could indicate a potential trend reversal. Consider closing your position or tightening your stop-loss to protect your profits.
- Stop-Loss Placement: Set your stop-loss below the trendline in an uptrend or above the trendline in a downtrend to minimize risk.
Conclusion
Mastering the art of trading with trendlines can significantly improve your ability to navigate the markets and make informed decisions. As you incorporate trendlines into your trading strategy, you’ll develop a deeper understanding of market trends and price movements, increasing your chances of success.
Remember, like any trading tool, trendlines are not infallible. Always use them in conjunction with other technical analysis tools and sound risk management practices to enhance your trading performance.
If this article was helpful, be sure to share it with friends! For more analysis sign up for our weekly newsletter breaking down the futures, and stocks we are liking into the following week!


