


Introduction
Moving averages are widely used by traders and investors to better understand market trends and make informed decisions. Among the various types of moving averages, the 20-day, 50-day, and 200-day moving averages are some of the most popular. In this blog post, we’ll delve into the benefits of these moving averages and provide backtested results from institutions to demonstrate their effectiveness.
Why Use Moving Averages?
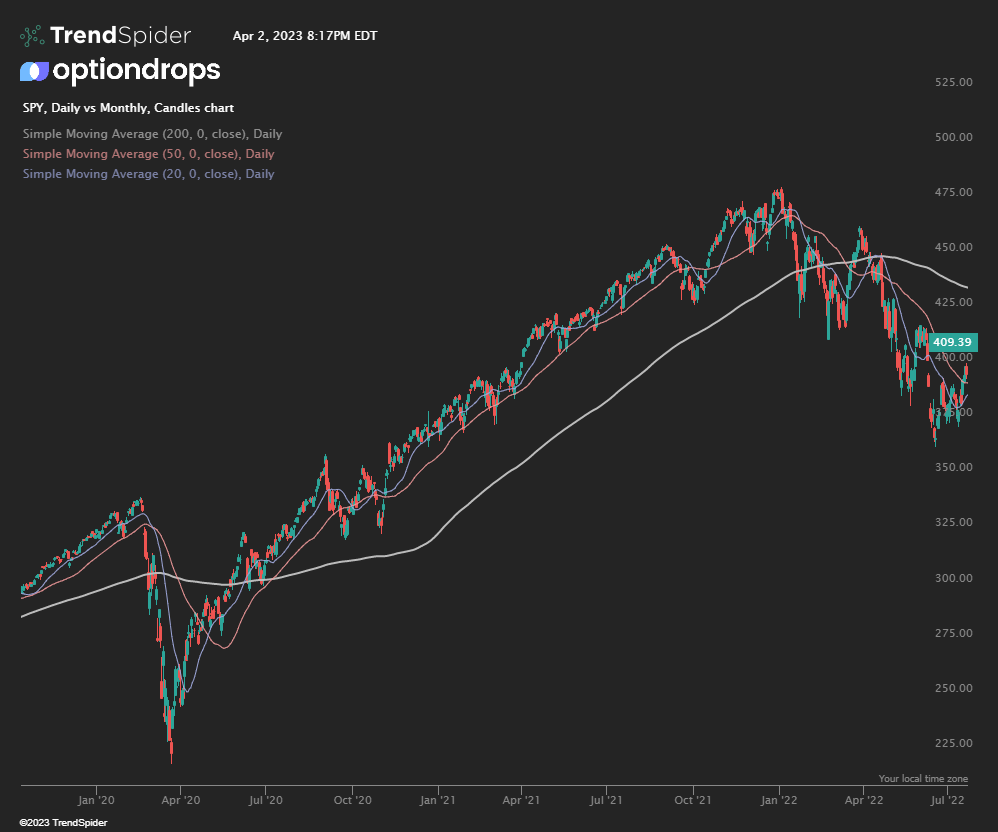
- Trend Identification: Moving averages help to smooth out price data, making it easier to identify overall trends in a market. They can be used to determine if the market is in an uptrend, downtrend, or a consolidation phase.
- Support and Resistance Levels: Moving averages often act as support and resistance levels, providing traders with potential entry and exit points.
- Signal Generation: Moving averages can be combined to generate trading signals, such as when a shorter moving average crosses above or below a longer one, which may indicate a potential change in trend.
Backtested Results from Institutions
Several institutions have conducted extensive research and backtesting on the effectiveness of moving averages. Some notable results include:
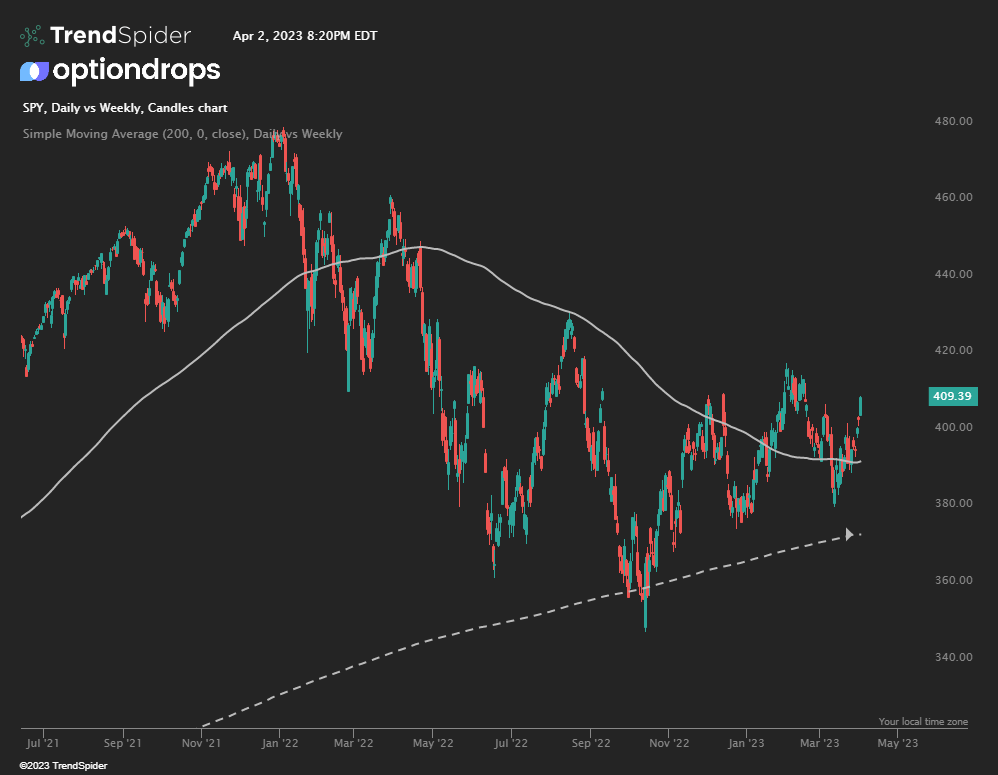
- Fidelity Investments: A Fidelity study found that a simple trading strategy involving the 50-day and 200-day moving averages outperformed the S&P 500 index by a significant margin over a 20-year period. When the 50-day moving average was above the 200-day moving average, the study suggested being fully invested in the market. Conversely, when the 50-day moving average was below the 200-day moving average, it recommended being in cash or a more conservative investment.
- Alpha Architect: In their research, Alpha Architect found that a dual moving average crossover strategy using the 20-day and 50-day moving averages yielded positive returns on the S&P 500 index over a 15-year period. The strategy involved buying the index when the 20-day moving average crossed above the 50-day moving average and selling when the 20-day moving average crossed below the 50-day moving average.
- Ned Davis Research: This institution’s research showed that the 200-day moving average has been an effective tool for determining the overall trend of the market. They found that since 1971, the S&P 500 has delivered an average annualized return of 10.7% when above its 200-day moving average and only a 0.3% return when below it.
Conclusion
The 20-day, 50-day, and 200-day moving averages have proven to be valuable tools for traders and investors. These moving averages can help to identify trends, provide support and resistance levels, and generate trading signals. Backtested results from institutions such as Fidelity Investments, Alpha Architect, and Ned Davis Research demonstrate the potential effectiveness of these moving averages in various market conditions. Incorporating these moving averages into your trading or investment strategy can help you make better decisions and potentially enhance your performance.
If this was beneficial be sure to share it with friends! We also have a daily newsletter where we cover topics such as this every week!