


In the world of trading, the volume-weighted average price (VWAP) indicator is a popular tool that can help traders identify potential buying and selling opportunities. In this blog post, we’ll discuss how to use the VWAP indicator in trading.
What is the VWAP Indicator?
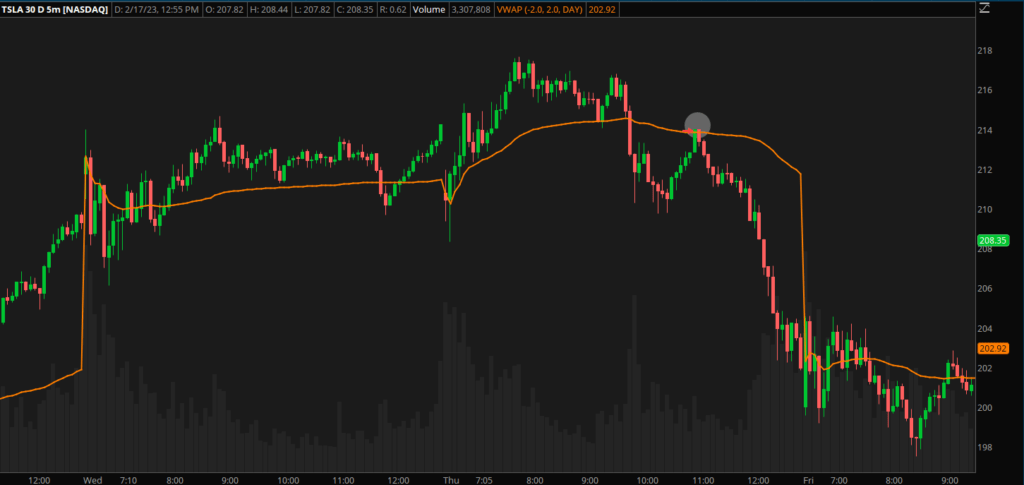
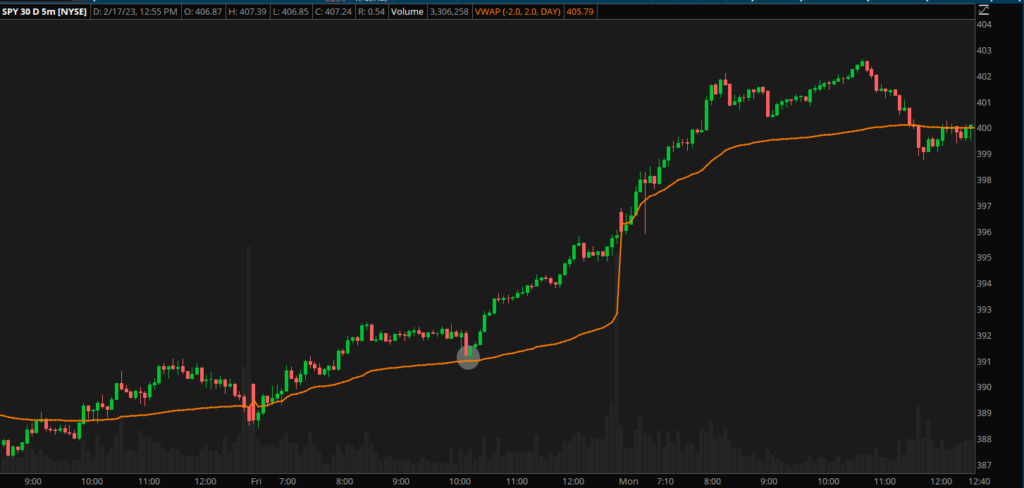
The VWAP indicator is a line that calculates the average price of a stock for the day or trading session, taking into account the volume of trades. When a stock is trending above the VWAP line, it typically means that buyers are in control, while a stock trending below the VWAP line typically indicates that sellers are in control.
Using the VWAP Indicator for Trading
Traders can use the VWAP indicator to identify potential entry or exit points. If a stock is trending below the VWAP line and then pulls back to it, it could be a great opportunity to enter a short position for the day. Conversely, if a stock is trending above the VWAP line and then pulls back to it, it could be an opportunity to enter a long position for the day.
Adding the VWAP Indicator to Your Charting Software
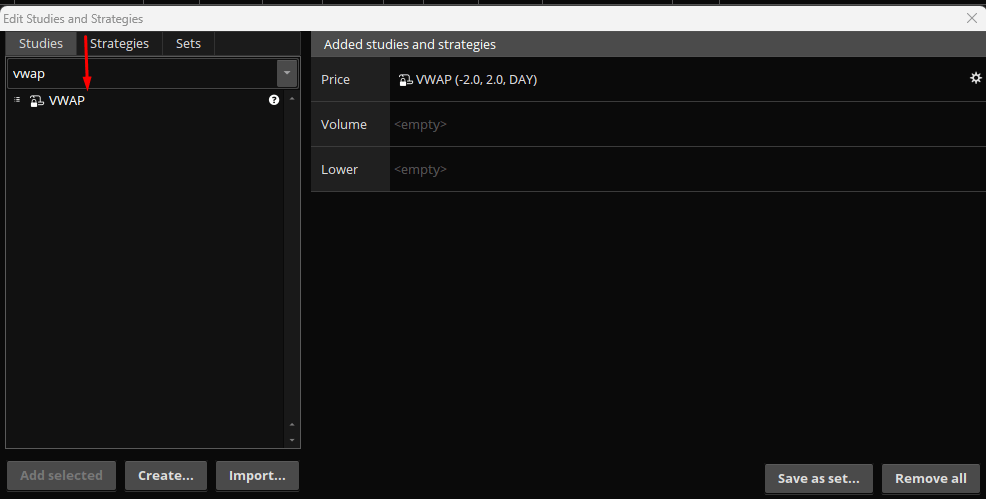
To use the VWAP indicator in trading, traders can either use the default indicator on their charting software or add it as a study tool. The VWAP line should remain in the same position across different time frames, making it a reliable indicator of market sentiment.
Microsoft Trade Example
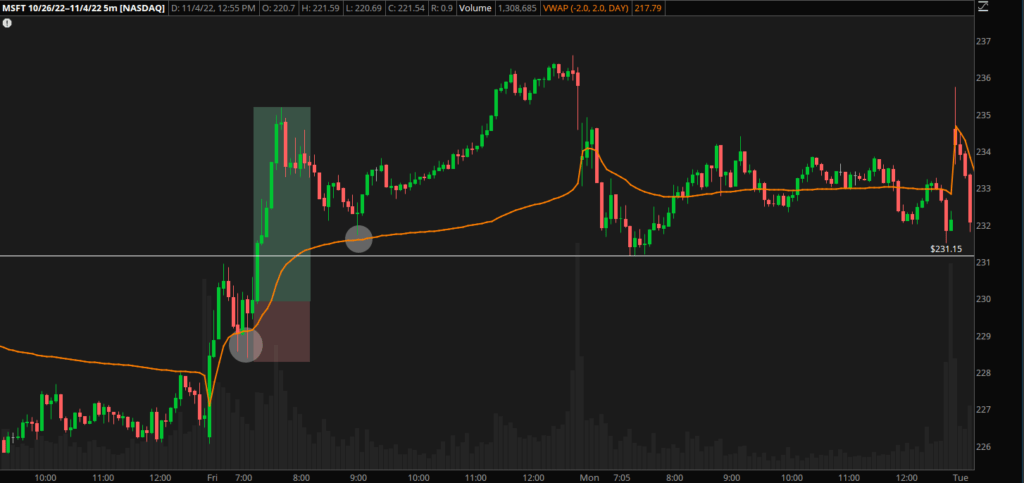
In the example of Microsoft on October 28th, the stock’s price pushed up to $231 before pulling back to the VWAP line at around $229. Traders could have entered a long position at this level, given the uptick in volume on the five-minute time frame around 7:20am PST. With a stop loss at the swing lows of around 228 and a target at the next resistance level of around 235, the trade could have resulted in a profitable outcome.
In conclusion, the VWAP indicator is a useful tool for traders looking to identify potential trading opportunities. By understanding how to use the indicator, traders can enhance their trading performance and make more informed decisions. As always, it’s important to incorporate risk management strategies and back test your trading strategies to identify potential challenges and overcome them effectively.
If you found any value from this post, please consider sharing this post to friends. If you want to receive market analysis, we publish a newsletter every Sunday. Thank you for reading!