Introduction
Stock trading can be a tricky business, especially when the stock suddenly reverses on you out of nowhere. However, there are ways to mitigate the risk and increase the chances of success by using key levels on a chart to make informed trading decisions.
The Top-Down Approach to Finding Key Levels
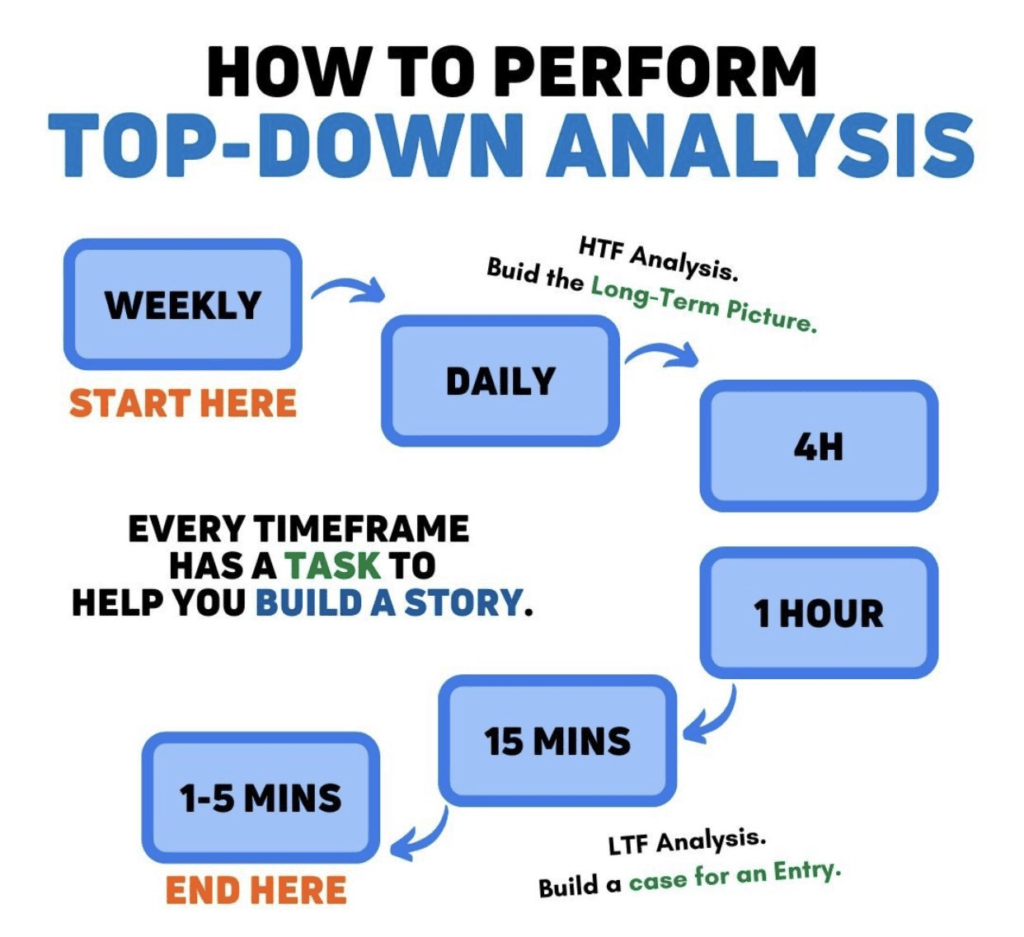
One approach to finding key levels is the top-down approach, which involves starting from a monthly timeframe and working your way down to the weekly, daily, and hourly timeframes to find new lows. This method can be particularly effective when trading large-cap tech stocks or Dow Jones names with a decent-sized market cap, as these stocks tend to respect key levels on the daily timeframe.
Finding Key Levels on Tesla’s Chart
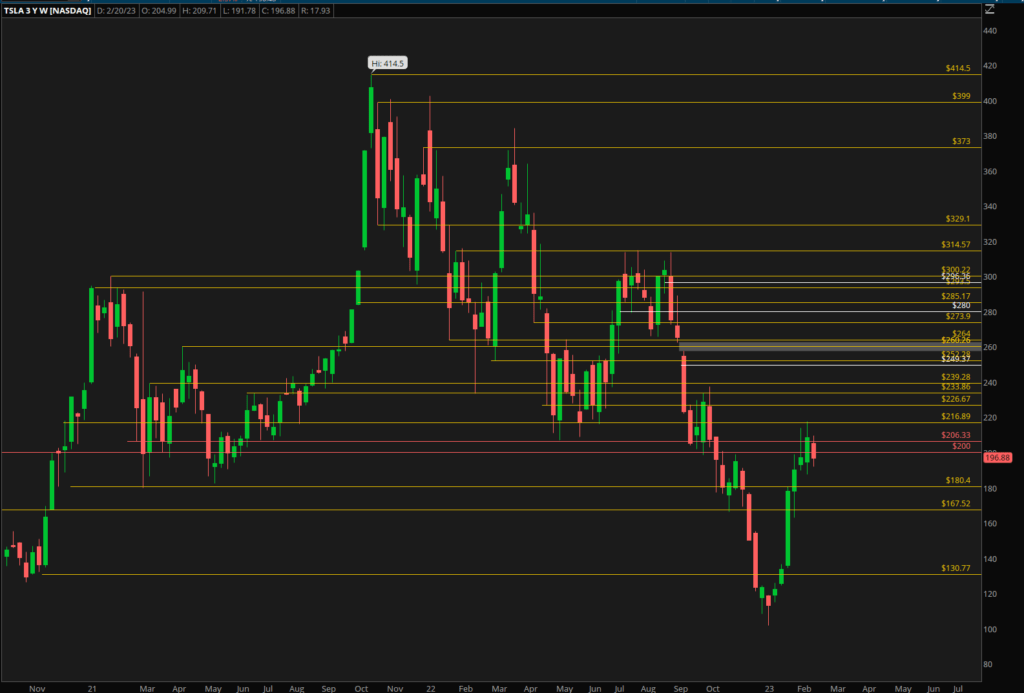
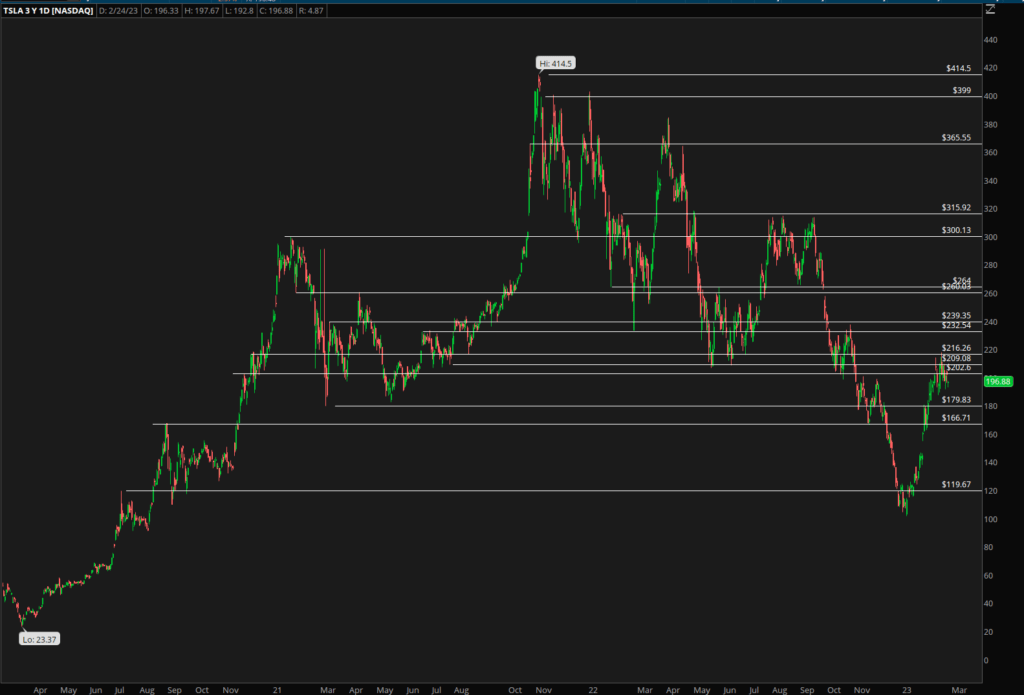
To demonstrate how to find key levels and take trades based on them, let’s take a look at the popular stock Tesla using the Thinkorswim platform. At first glance, the chart may appear messy with numerous lines and markings, but upon zooming in to an intraday timeframe, it becomes clear how precisely the stock bounces off these high levels. This can make it easier to base trades off of and provide a better risk-reward ratio compared to taking trades in the middle of nowhere.
How to Find Key Levels on a Chart
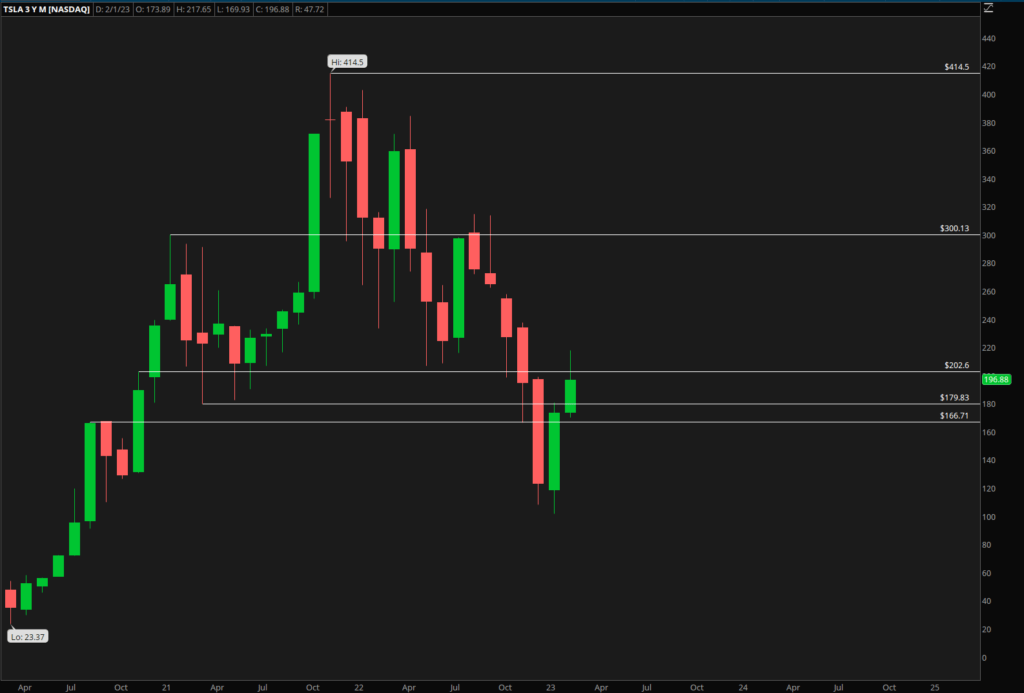
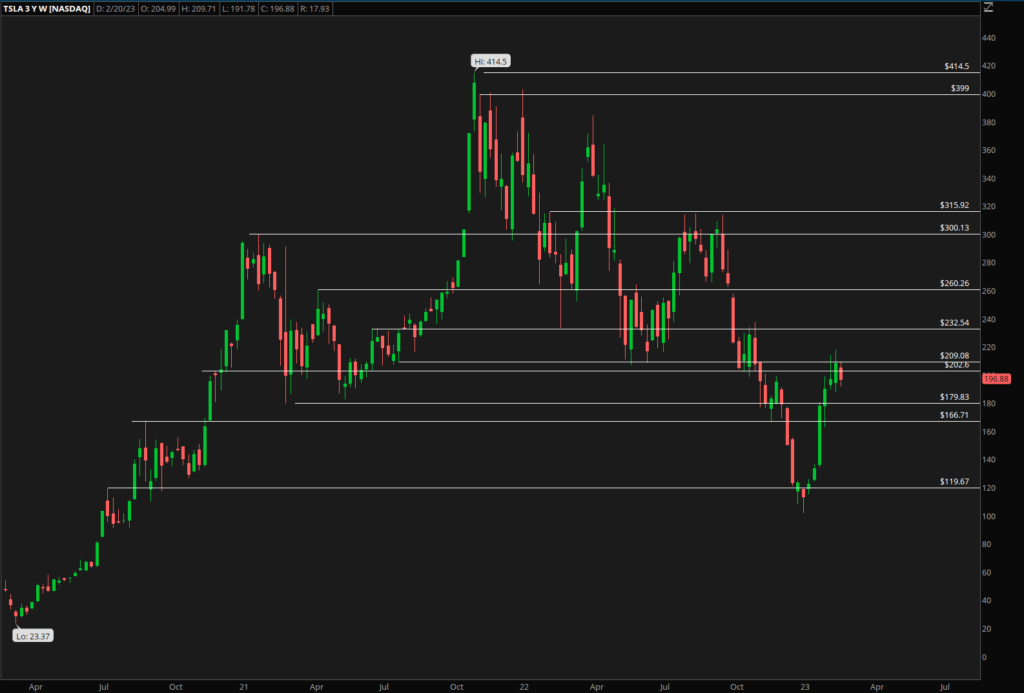
To find key levels, start with the monthly timeframe and mark the highs and lows. Name each level and draw a line to represent it. Repeat this process for the weekly and daily timeframes, documenting all relevant price rejections and previous levels the stock has bounced off of.
Example of a Key Level on Tesla’s Chart
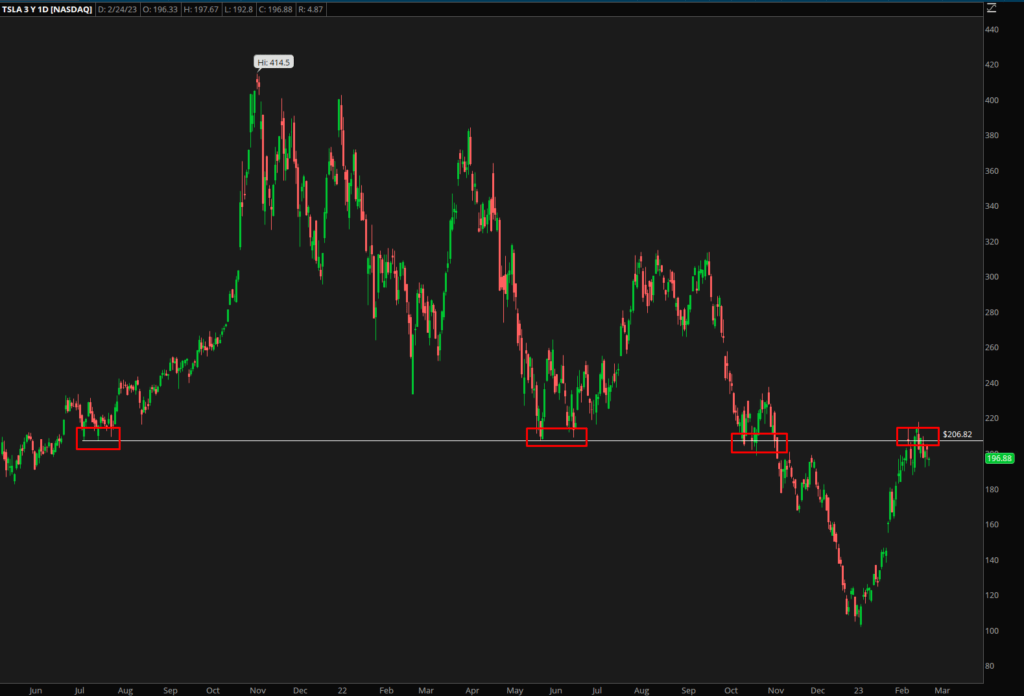
For example, on Tesla’s chart, the swing low in July 2021 at about $206 was a key level. When the stock price reached this level again on May 23, 2022 it bounced off it perfectly, again in October 2022, and at the time of writing this article finding resistance off of this level in February 2023. indicating that this was a significant level for the stock.
Taking Trades off of Key Levels
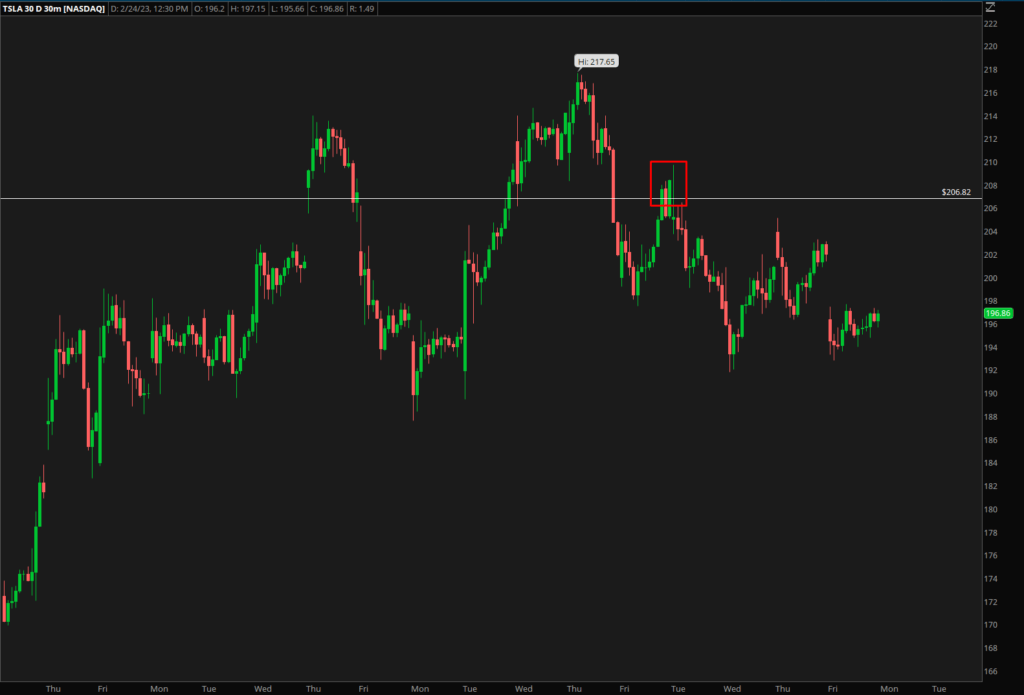
When trading stocks based on key levels, it is essential to have a solid trade plan in place and carefully select the right strike. For instance, if you plan to swing trade TSLA at the key level of $206, it is advisable to switch to a lower time frame and observe the price action and how the stock is responding to this level.
In the following example, TSLA approached this level again on the 15-minute timeframe and started encountering sellers. This provided an opportunity to take a short position at this level and ride the stock’s downward trend, resulting in a profit of approximately $192.
By closely monitoring the stock’s behavior and price action at key levels, traders can make informed trading decisions and optimize their chances of success in the market.
Conclusion
By utilizing key levels on a chart, traders can have a clearer understanding of where to take trades, what levels to avoid, and how to plan their trades based on historical levels or prices that the stock has previously bounced off of or been rejected. While there is no guarantee of success in the stock market, this approach can provide a more informed strategy for trading.
If this article helped you or if you learned anything, consider sharing this on social media or with friends. If you want weekly market analysis, consider joining our newsletter!


